A lot has changed since we first published our Twitter Sentiment Analysis on United Airlines in 2017. We have updated this post to include new information and examples.
Over the past two weeks, the internet’s viral outrage has been targeting United Airlines, the brand that has been in crisis mode after a bloodied passenger was forcibly dragged off a plane. Millions of people witnessed videos of the incident being spread over social media.
In today’s interconnected world, a public relations crisis can start with one tweet. While American Airlines might be feeling great about the millions of mentions the brand received on Twitter, the brand could be in trouble if most mentions are filled with complaints and sarcasm.
In this blog, we will walk you through how to conduct a step-by-step sentiment analysis using United Airlines’ tweets in 2017 and American Airlines’ actions in 2020 as examples. Before we start, let’s first introduce the topic of sentiment analysis and discuss the purpose behind sentiment analysis.
What is Sentiment Analysis?
Sentiment Analysis is the process of determining whether a piece of writing (product/movie review, tweet, etc.) is positive, negative, or neutral. It can be used to identify the customer or follower’s attitude towards a brand through the use of variables such as context, tone, emotion, etc. Marketers can use sentiment analysis to research public opinion of their company and products or to analyze customer satisfaction. Organizations can also use this analysis to gather critical feedback about problems in newly released products.
Sentiment analysis not only helps companies understand how they’re doing with their customers, it also gives them a better picture of how they stack up against their competitors. For example, if your company has 20% negative sentiment, is that bad? It depends. If your competitors have a roughly 50% positive and 10% negative sentiment, while yours is 20% negative, that merits more discovery to understand the drivers of these opinions. Knowing the sentiments associated with competitors helps companies evaluate their own performance and search for ways to improve.
How to Perform Sentiment Analysis?
There are many tools that provide automated sentiment analysis solutions. In this blog, I will illustrate how to perform sentiment analysis with MonkeyLearn and Python (for those individuals who want to build the sentiment analyzer from the scratch). MonkeyLearn is a highly scalable machine-learning tool that automates text classification and sentiment analysis. With built-in public modules in MonkeyLearn, we will be able to get results quickly with no machine learning knowledge. Regardless of what tool you use for sentiment analysis, the first step is to crawl tweets on Twitter.
Step 1: Crawl Tweets Against Hash Tags
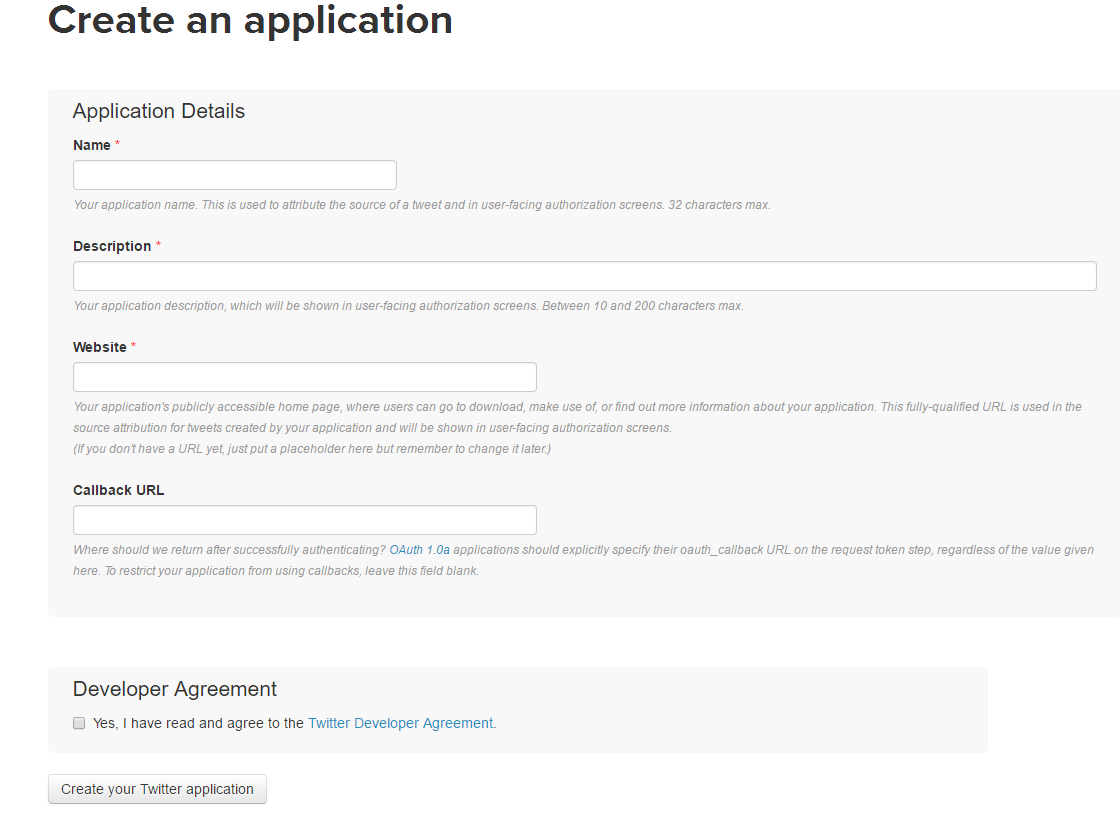
To have access to the Twitter API, you’ll need to log in to the Twitter Developer website and create an application. Enter your desired Application Name, Description, and website address making sure to enter the full address including the https://. (You can leave the callback URL empty.)
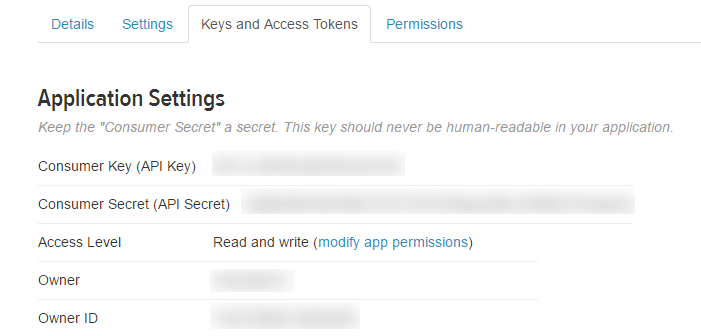
After registering, create an access token and grab your application’s Consumer Key, Consumer Secret, Access token, and Access token secret from the Keys and Access Tokens tab.
Then, put this information into the variables defined in the Python code attached here:
This Twitter Crawler allows you to scrape tweets against hash tags and store the tweets into a CSV. For this tutorial, I scraped all the tweets containing #UnitedAirlines from April 3, 2017, to April 16, 2017.
Step 2. Analyzing Tweets for Sentiment
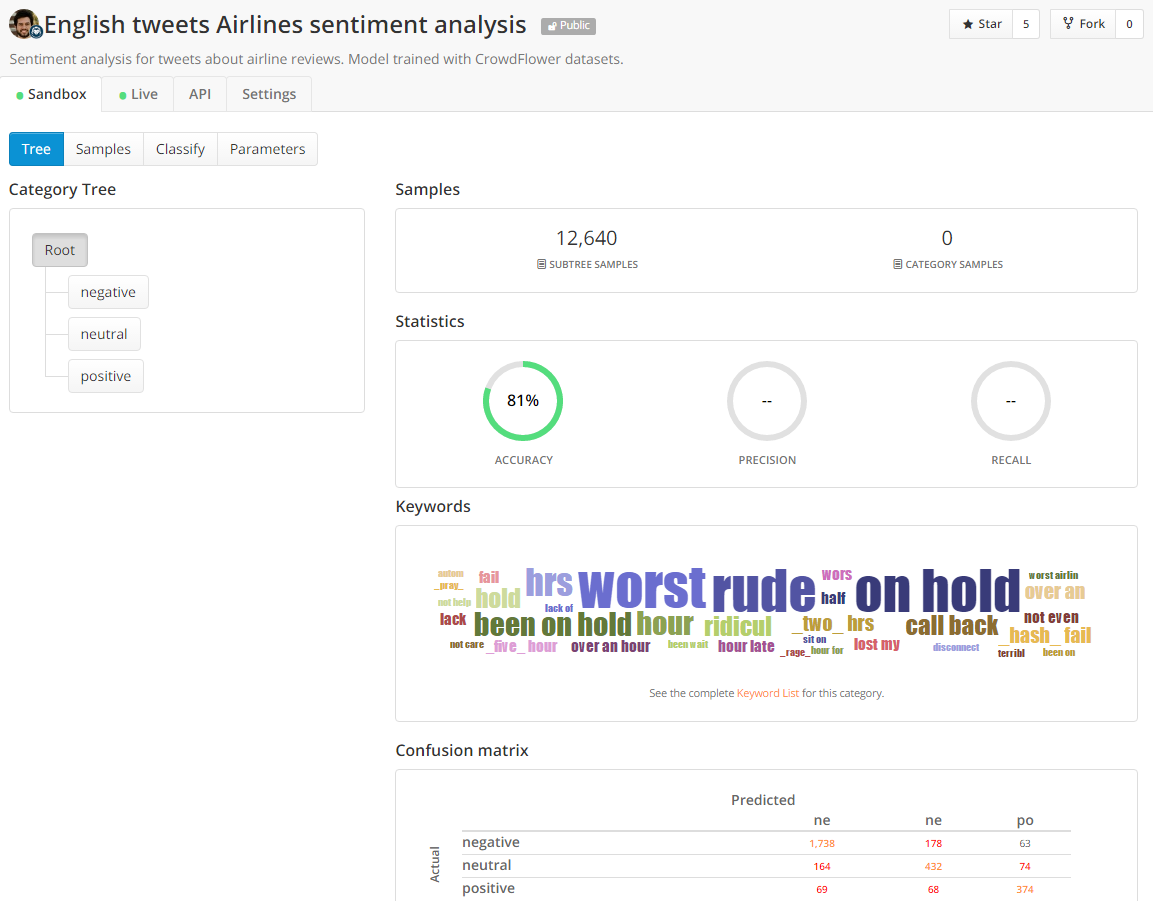
MonkeyLearn has a built-in module “English tweets airlines sentiment analysis” that analyzes sentiments for tweets about airline reviews. This module can classify airline tweets into positive, negative, and neutral with an accuracy of 81%.
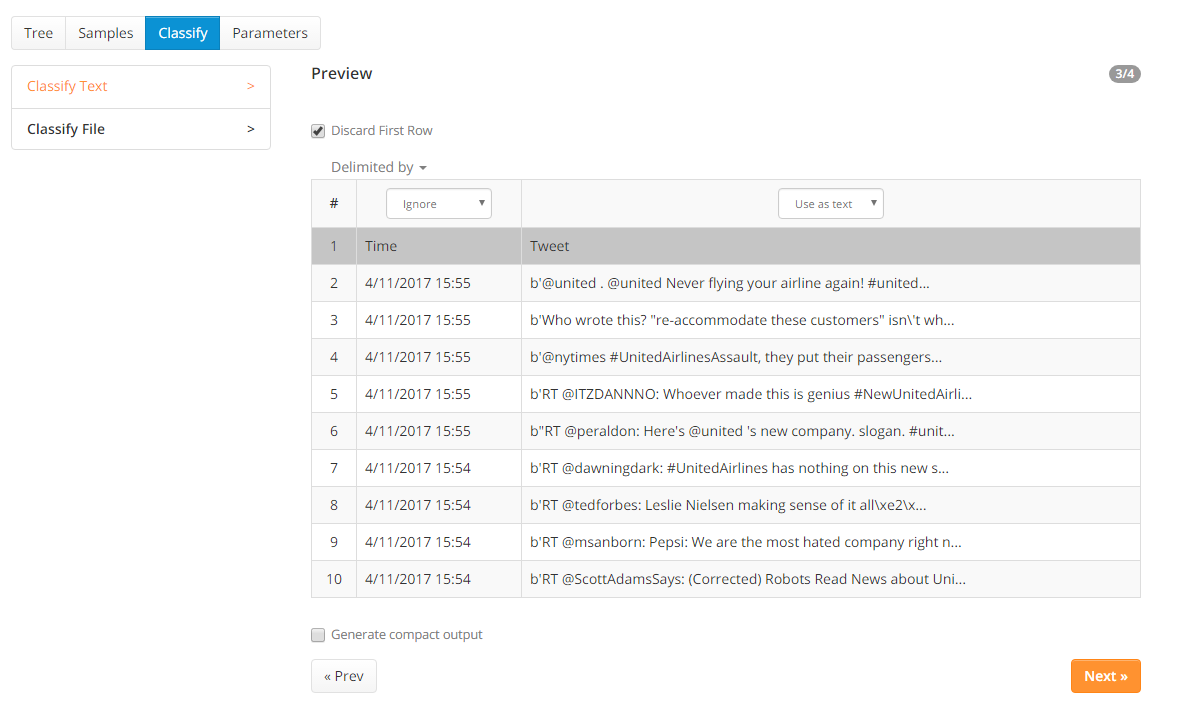
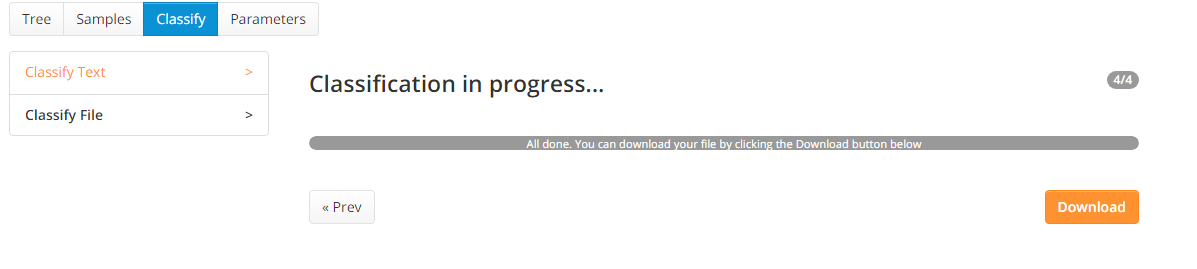
When uploading the .csv file that contains United Airlines tweets in MonkeyLearn, we need to discard the first row and ignore the time column.
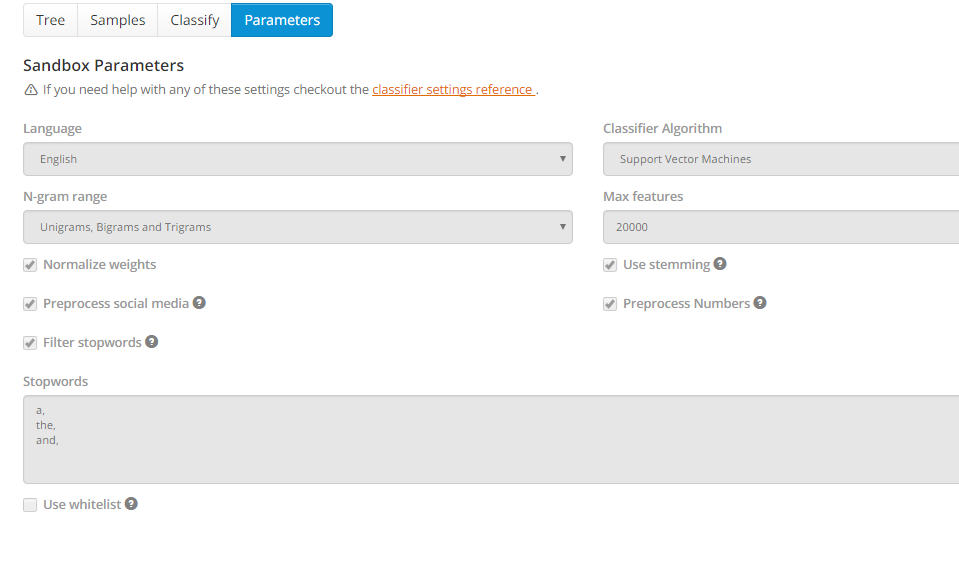
In this built-in module, text data is automatically preprocessed, and stop words are filtered out before applying the support vector machine algorithm.
With this text classifier, we can label each Tweet as positive, negative, and neutral sentiment in a few minutes. However, human language is complex. Teaching a machine to analyze the various grammatical nuances, cultural variations, slang, and misspellings that occur in social media is a difficult process. Teaching a machine to understand how context can affect tone is even more difficult. Humans are fairly intuitive when it comes to interpreting the tone of a piece of writing. Consider the following example:
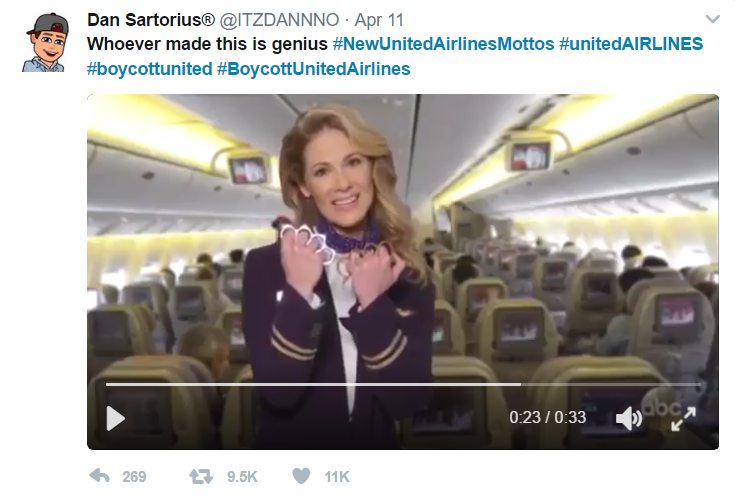
Most humans would be able to quickly interpret that the tweet was attempting irony about United Airlines’ disastrous “passenger re-accommodation”. By applying this contextual understanding to the sentence, we can easily identify the sentiment as negative toward United Airlines. Without contextual understanding, a machine looking at the sentence above might see the word “genius” and categorize it as positive.
The above example shows how sentiment analysis has its limitations and is not to be used as a 100% accurate marker. As with any automated process, it is prone to error and often needs a human eye to watch over it.
Step 3: Visualizing the Results
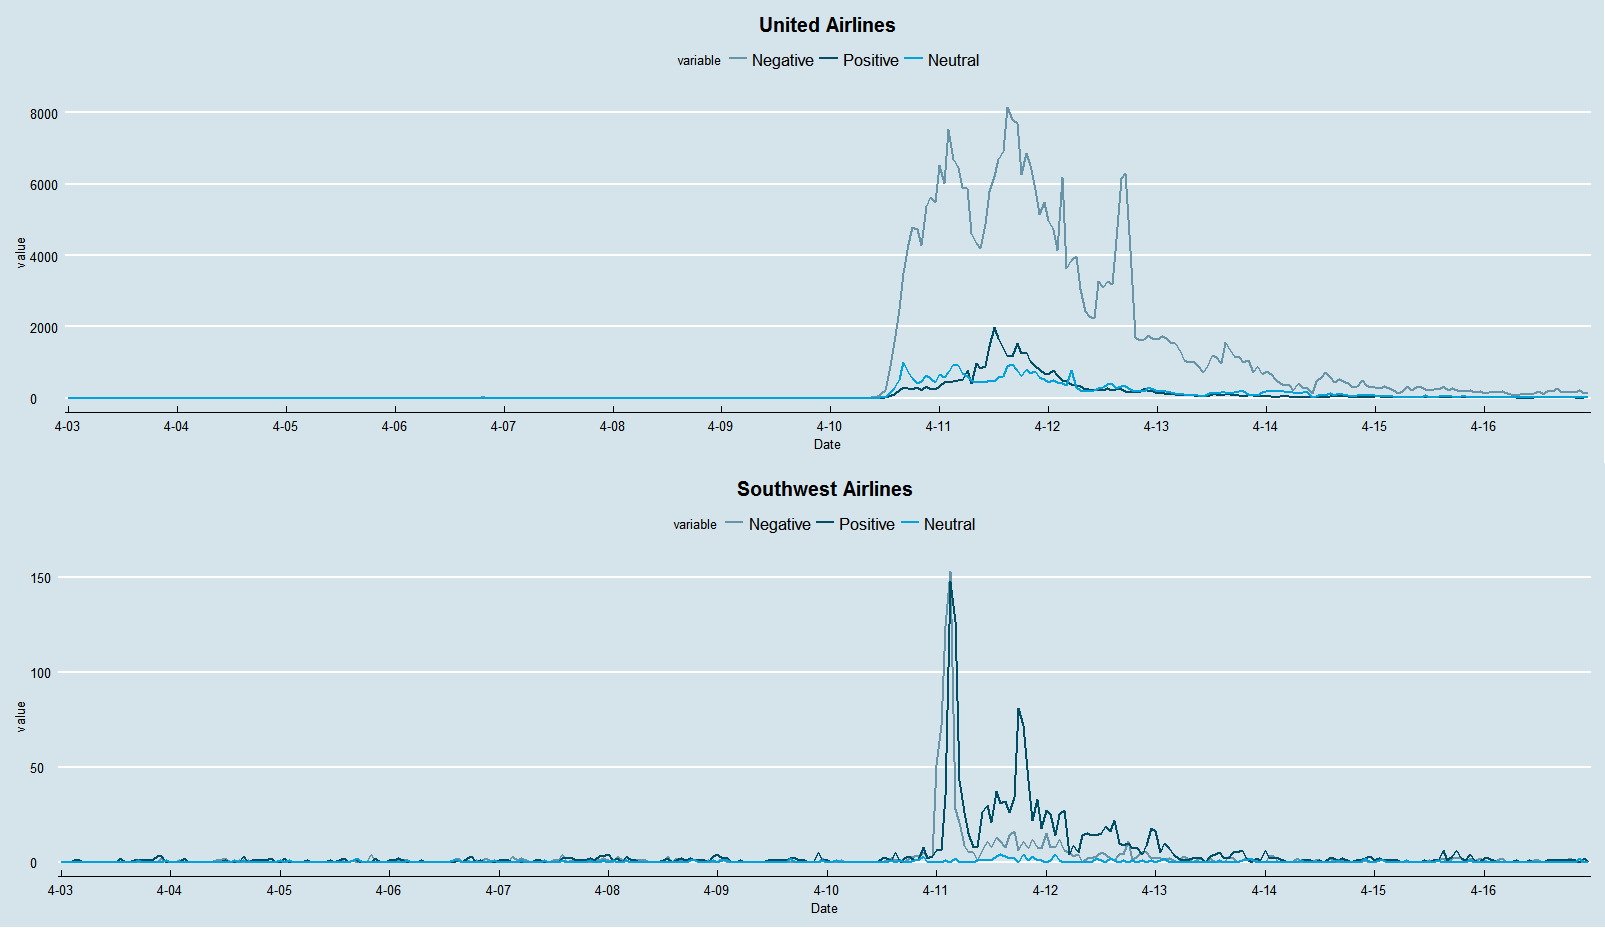
After United Airlines’ forcibly removed a passenger from a plane, brand mentions of United Airlines exploded on Twitter overnight. At the same time, a fake slogan for Southwest airlines, “we beat the competition, not you”, was widely spread across social media (which was not produced by Southwest). The graph below visualizes how brand mentions of both United Airlines and Southwest Airlines fluctuated from April 3 to April 16 (one week before and after the incident).
As you can see from this graph, there are much more negative tweets about United Airlines than positive tweets since April 10. It also shows how many brand mentions Southwest gained from United Airlines’ PR crisis. From this graph, we establish an idea of how much attention (positive vs negative) this topic brought during the past two weeks. The graph below specifically visualizes the negative sentiments for both United and Southwest Airlines.
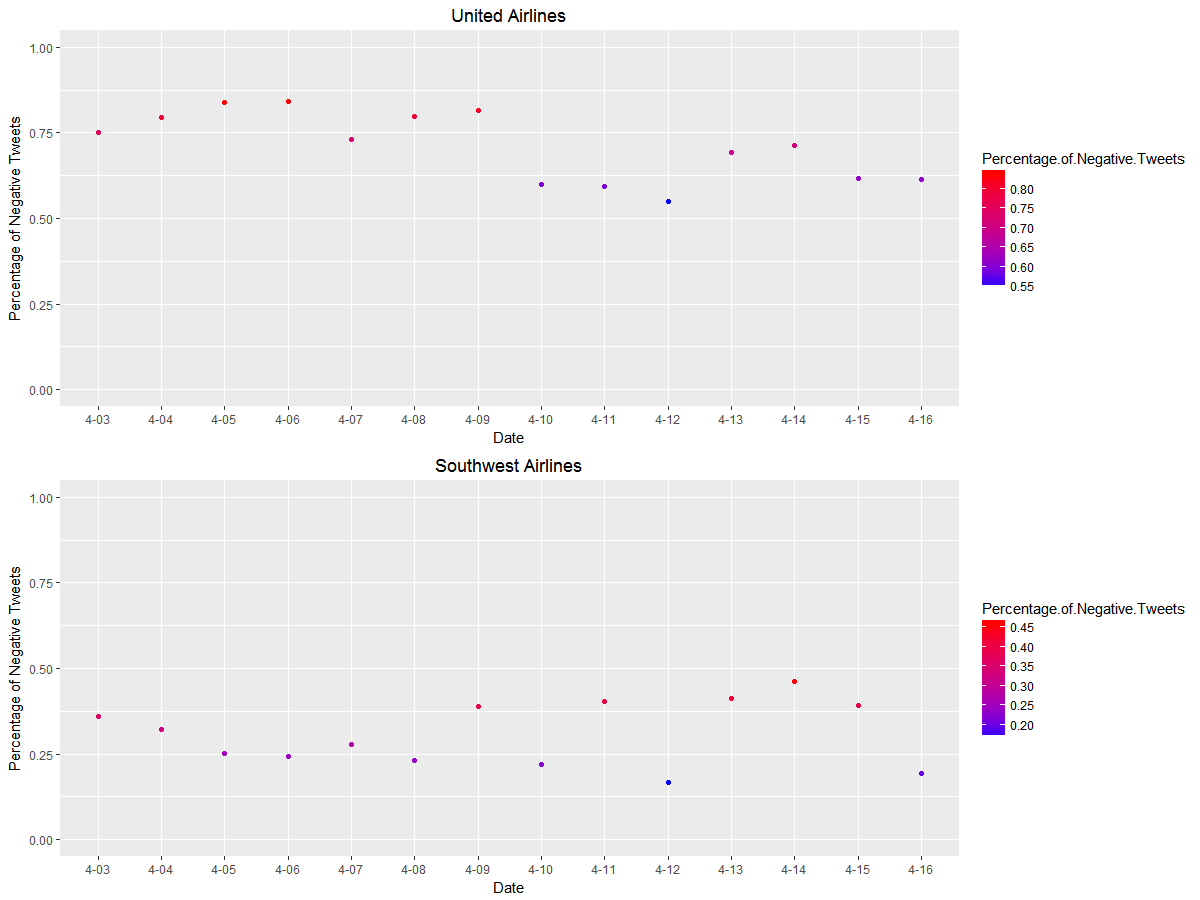
This graph shows the ratio of the number of negative tweets to the total number of tweets mentioning United Airlines and Southwest Airlines. This explains how negative the discussion is on Twitter surrounding the two major airlines. All in all, United Airlines has a much higher percentage of negative tweets compared to Southwest Airlines even before the incident. Interestingly, the ratio of negative tweets mentioning United slightly decreased after the incident, which occurred on April 10th.
On the contrary, the percentage of negative tweets discussing Southwest increased. This is due to the fact that before United Airlines’ PR crisis, there were very few tweets mentioning United or Southwest Airlines. For example, if United Airlines only had three negative tweets and one positive tweet that day, the ratio of negative tweets would turn out to be 0.75. With the increasing number of tweets, the ratio of negative tweets tends to be more robust to small changes.
In the beginning, it might be difficult to understand why the percentage of negative tweets for Southwest Airlines, which was supposed to be benefiting from this crisis, increased instead of decreased. With further investigation, we discovered that the machine was confused by negative sentiments that include both United Airlines and Southwest Airlines. For example, a tweet that claims, “Don’t think I’ll be flying #unitedAIRLINES ever again… #SouthwestAirlines” will confuse the sentiment analyzer and be classified as negative. This indicates another limitation of sentiment analysis: it’s hard for machines to distinguish sentiments for different subjects.
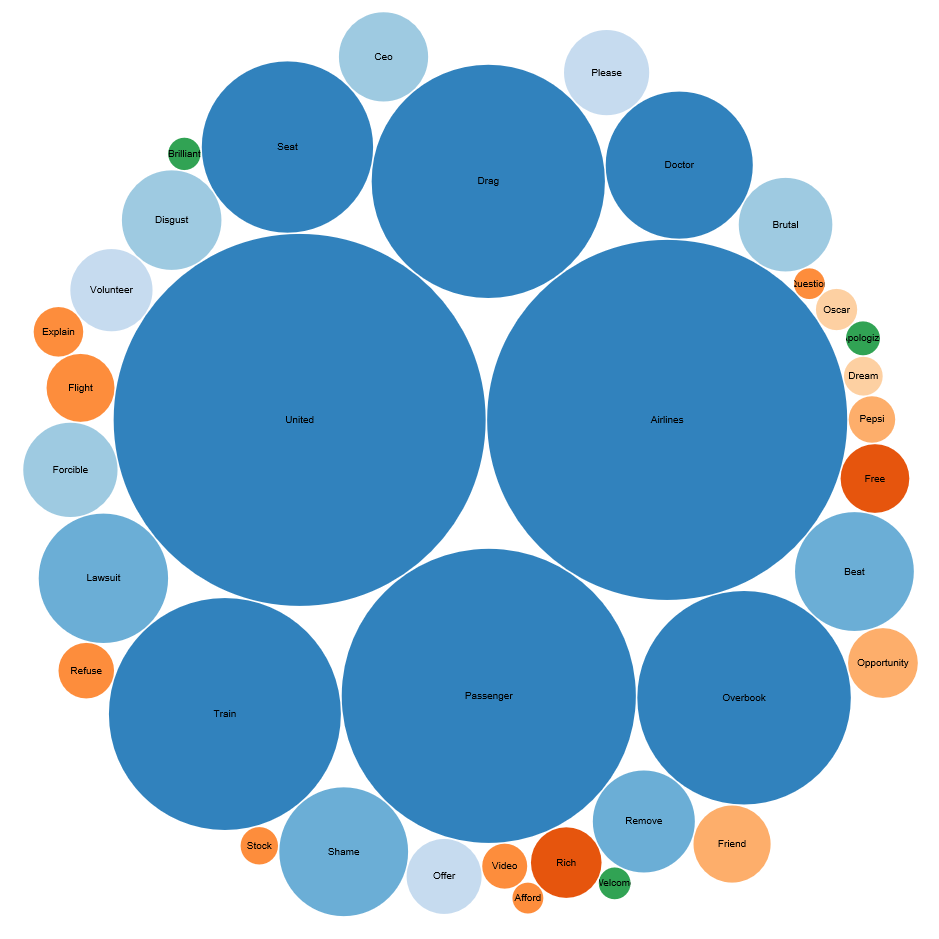
Sentiment analysis can also discover the most frequently used words among positive, negative, or neutral tweets. In the chart below, the larger the size of the bubble indicates the higher frequency of the word appearing in a set of tweets. From the bubble chart, we can see the most frequent words in negative tweets are “united”, “airlines”, “passenger” and “overbook”. While compared to negative sentiments, words in positive tweets appear in much smaller magnitude, such as “friend”, “opportunity”, “brilliant” and “welcome”, some of them are actually sarcastic about this incident.
Build Your Own Sentiment Analyzer
For those who are interested in the methodology behind sentiment analysis, I will briefly explain the algorithm and introduce a way to build your own sentiment extractor in Python. The purpose of the sentiment extractor is to be able to automatically classify a tweet as a positive, negative, or neutral sentiment, which can be reformulated as a classification task in the machine learning world. Classification is the task of choosing the correct class label for a given input. One example of a classification task is: deciding what the topic of a news article is, from a fixed list of topic areas such as “sports,” “technology,” and “politics.”
In this section, we will deal with the Naive Bayes Classifier and Support Vector Machines, which are both built on training corpora while containing the correct label for each input, hence these methods fall under the category of supervised classification. You can find the detailed code here.
Step 1: Training the Classifiers
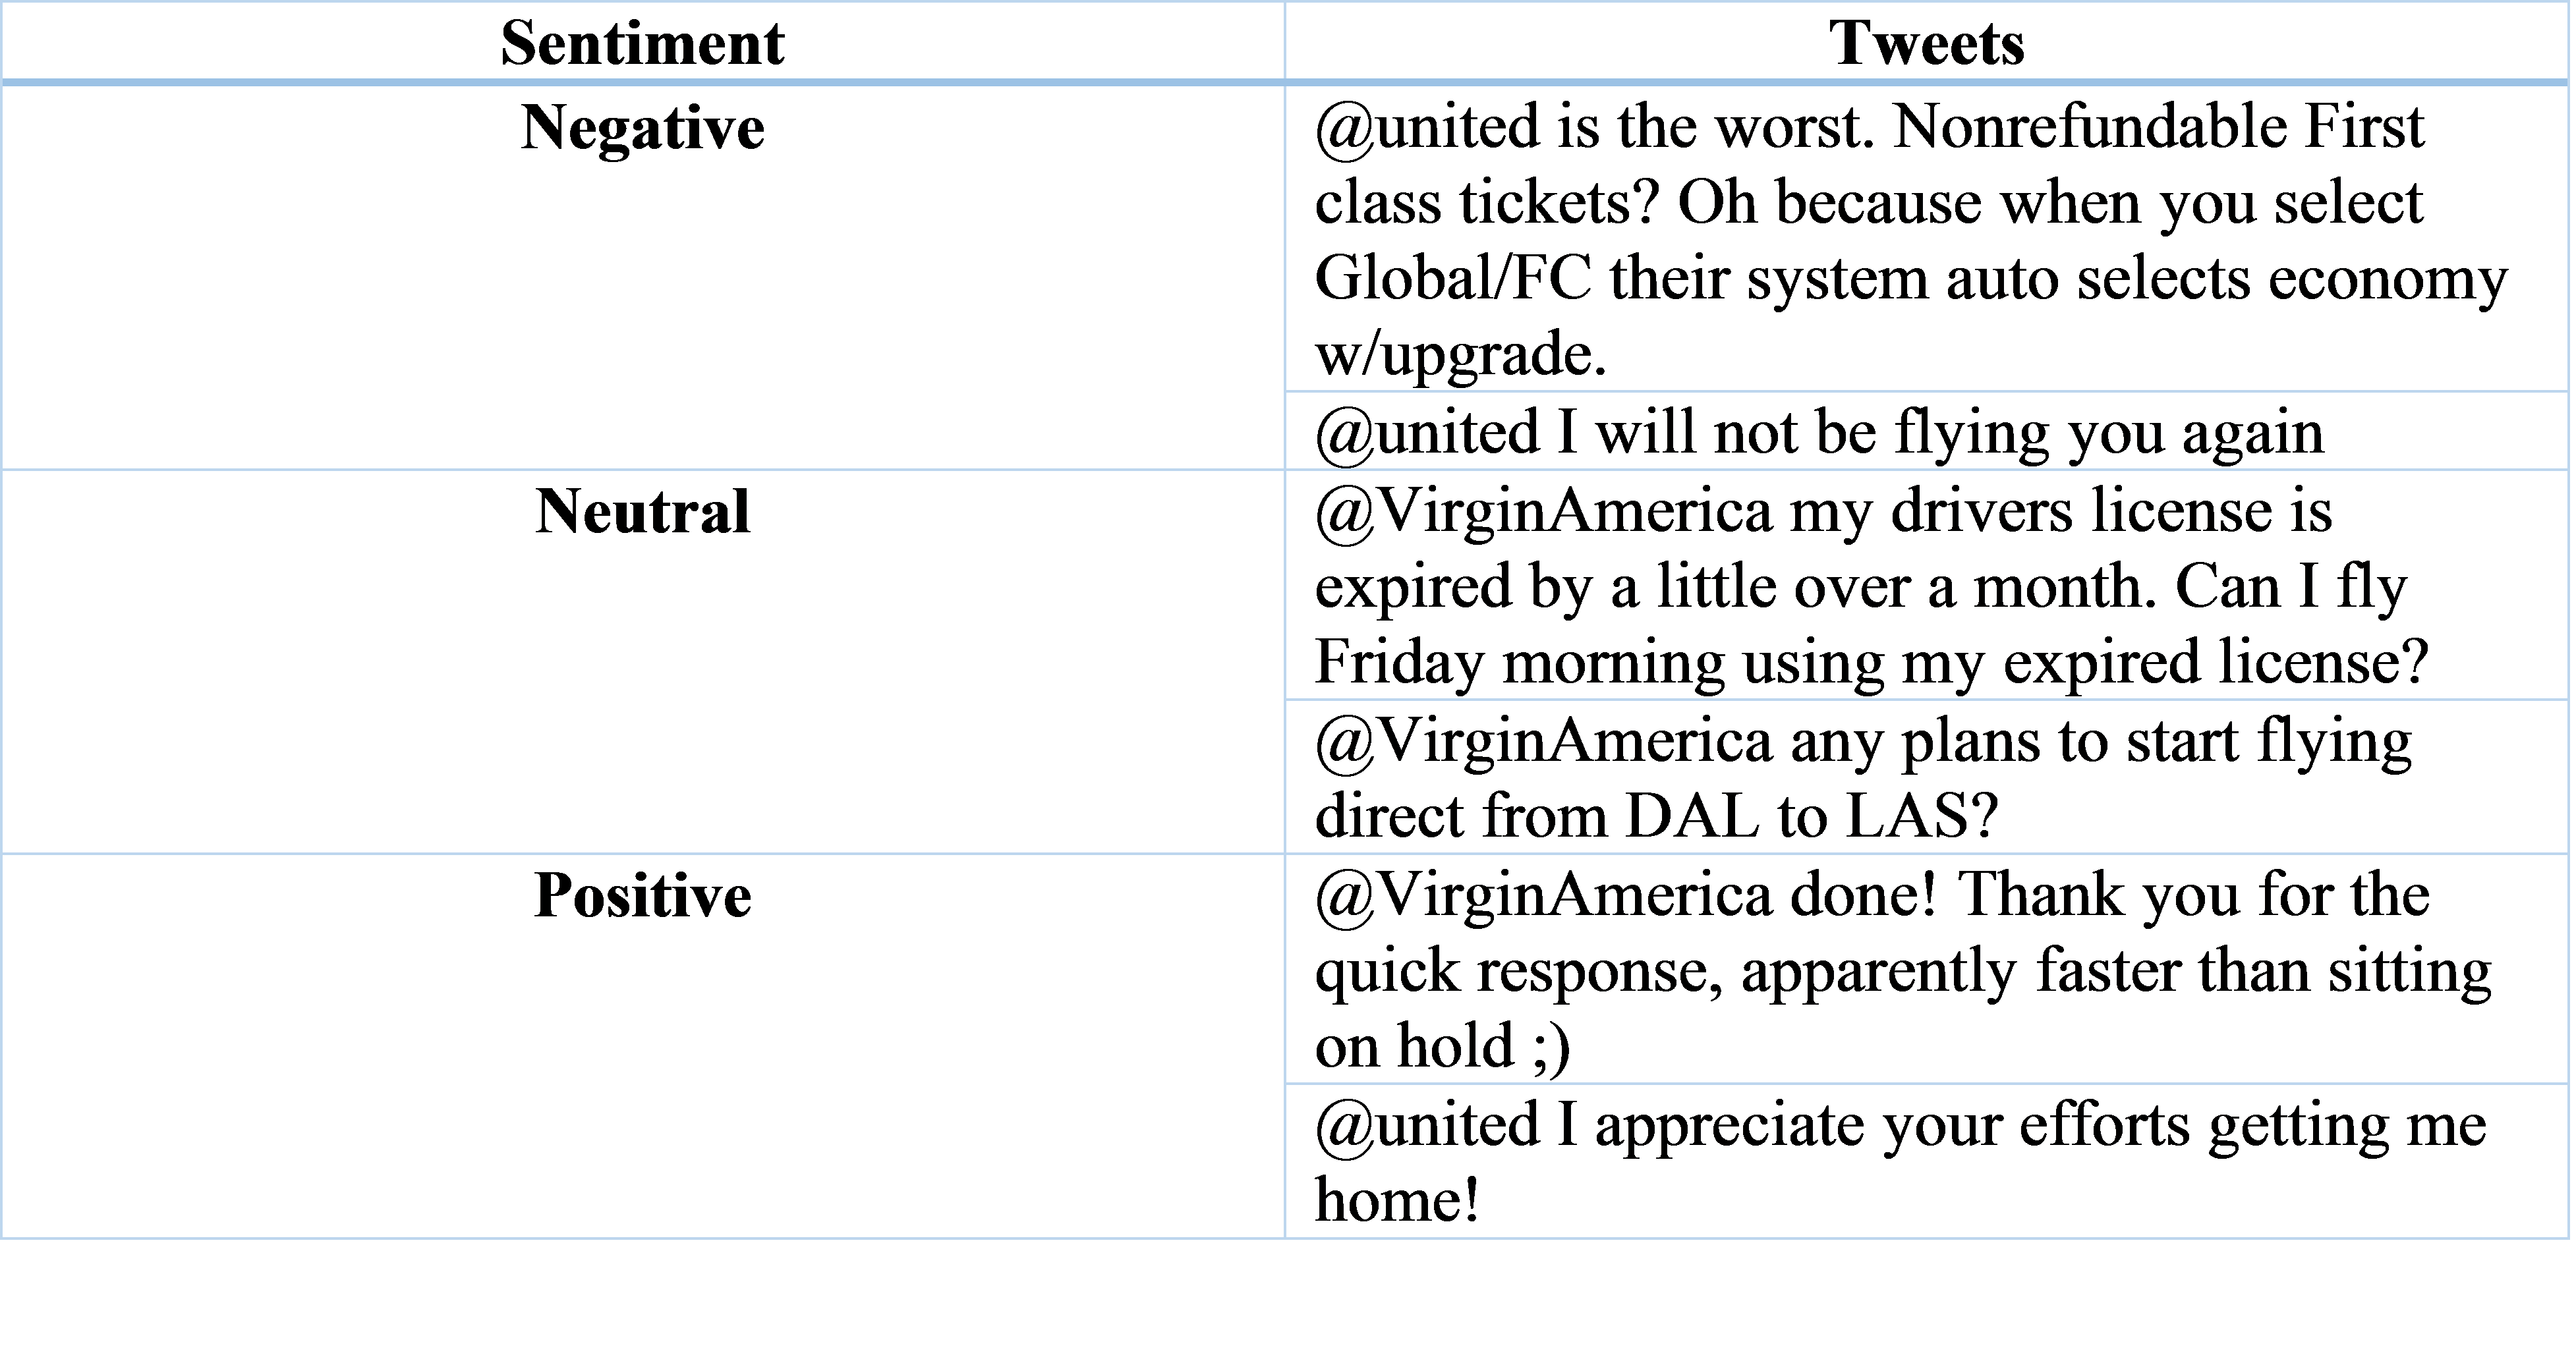
To obtain training data for sentiment analysis, I downloaded the airline Twitter sentiment dataset from Figure Eight (previously CrowdFlower), which is also used in the “English tweets airlines sentiment analysis” module from MonkeyLearn.
Here are some sample tweets along with classified sentiments:
Step 2: Preprocess Tweets
Before we start building the analyzer, we first need to remove noise and preprocess tweets by using the following steps:
- Lower Case – Convert the tweets to lowercase.
- URLs – Eliminate all of these URLs via regular expression matching or replace them with generic word URLs.
- @username – Remove “@username” via regex matching or replace it with the generic word AT_USER.
- #hashtag – replace hashtags with the exact same word without the hash (hashtags may provide some useful information), e.g. #boycottUnitedAirlines replaced with ‘ boycottUnitedAirlines ‘.
- Punctuations and additional white spaces – remove punctuation at the start and ending of the tweets, e.g: ‘ the day is beautiful! ‘ replaced with ‘the day is beautiful’. We also replace multiple whitespaces with a single whitespace.
Step 3: Extract Feature Vectors
One important step in building a classifier is deciding what features of the input are relevant, and how to encode those features. For example, we can use the ending letter of the names as a feature and build a classifier to identify gender with these distinctive features. Specifically, names ending in a, e and i are likely to be female, while names ending in k, o, r, s, and t are likely to be male.
Similarly, we can use the presence or absence of words that appear in tweets as features. In the training data, we can split each tweet into words and add each word to the feature vector. Some of the words might not indicate the sentiment of a tweet and we can filter them out. Then merge individual feature vectors into a large list that contains all the features and remove duplicates in this list.
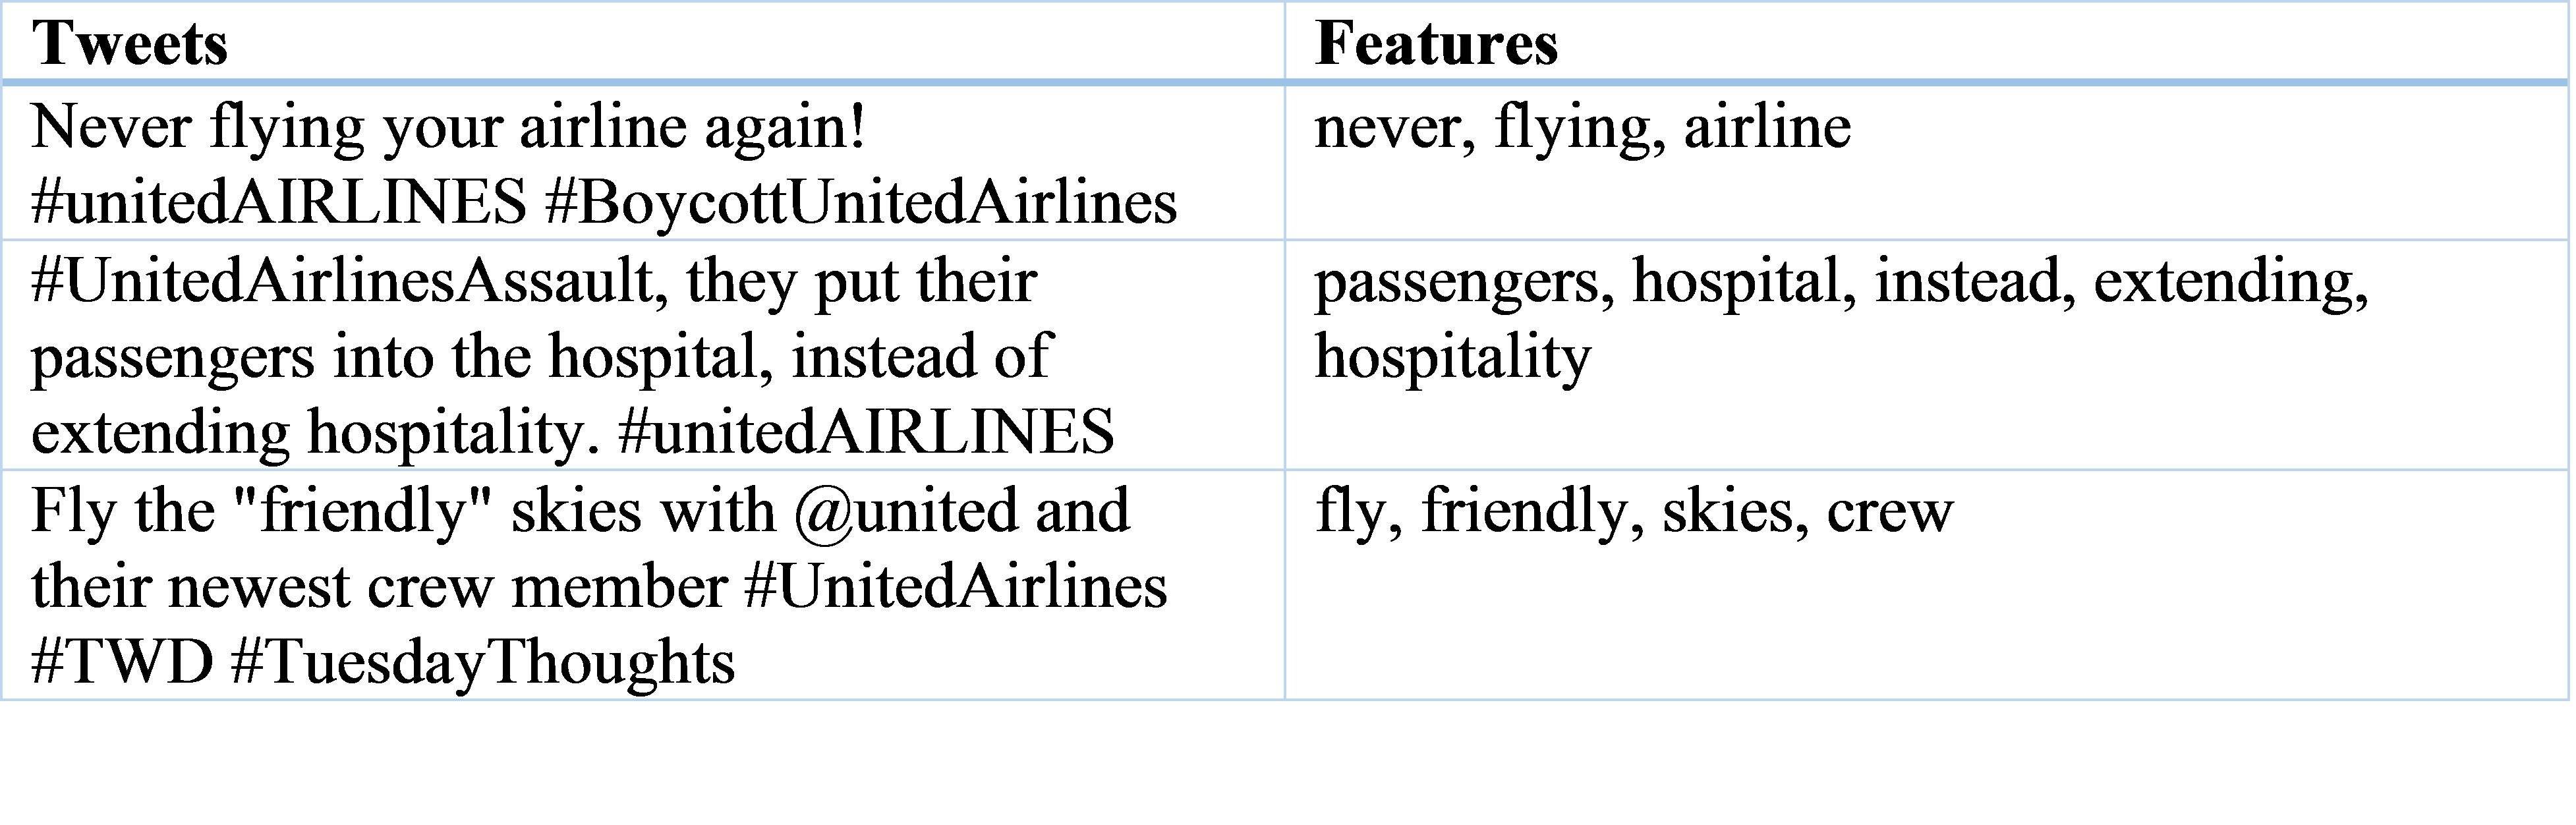
Adding individual words to the feature vector is referred to as the ‘unigrams’ approach. Here, for simplicity, we will only consider the unigrams, and below are some examples of features extracted from tweets.
To explain how a Naive Bayes Classifier or Support Vector Machine works is beyond the scope of this post. In my earlier post, I have some examples explaining the algorithms of Naive Bayes and Support Vector Machines. In this post, I will gloss over the mathematical and statistical underpinnings of these techniques, focusing instead on how and when to use them.
Naive Bayes Classifier
In Naive Bayes classifiers, every feature impacts which label should be assigned to a given input value. To choose a label for an input value, the naive Bayes classifier begins by calculating the prior probability of each label, which is determined by checking the frequency of each label in the training set. At this point, we have a training set, so all we need to do is instantiate a classifier and classify test tweets.
Support Vector Machines
The Support Vector Machine (SVM) algorithm tries to find a hyperplane that separates the data into two classes as optimally as possible. However, for sentiment analysis, we have three classes (positive, neutral, and negative). How can we tackle datasets with more than two classes?
There are two approaches for decomposing a multiclass classification problem into a binary classification problem: the one-vs-all and one-vs-one approaches. In the one-vs-all approach, one SVM Classifier is built per class. This Classifier takes that one class as the positive class and the rest of the classes as the negative class. In the one-vs-one approach, you build one SVM Classifier per chosen pair of classes. To make things simple, we chose the one-versus-all approach where we decomposed our problem into training three binary classifiers.
When building your own analyzer, there is no best algorithm that fits all types of text data. According to Stanford University research, Naive Bayes outperforms Support Vector Machines on short snippet sentiment classification tasks, while an SVM is a stronger performer when analyzing sentiments for longer reviews.
To summarize, this blog provides two methods to perform sentiment analysis for both marketers and data scientists either with MonkeyLearn or Python. MonkeyLearn is a quick and convenient tool to start sentiment analysis. Once you are comfortable with sentiment analysis, you can start building and experimenting with your own sentiment analyzer.
[2020 Update] How to Use a State-of-art Pre-trained Model for Sentiment Analysis
When the situation of COVID-19 became more and more serious, especially after the Centers for Disease Control and Prevention (CDC) recommended people continue social distancing and wearing face masks, more and more people appear to be concerned about group activity.
On May 17, FOX6 posted a video on Twitter posted by an American Airlines passenger. The video shows a crowded plane with most of the passengers not wearing face masks. The passenger, who was wearing a face mask, also said that she has never felt so unsafe in her life.
Why do brands need to know about Sentiment Analysis?
1. Drive effective business strategies
For most companies, all business activities follow a business strategy. How could you (business owner, marketing manager, etc.) know whether the strategy suits the customer needs and when you should change the strategy? Sentiment analysis can not only let you know what customers think of your marketing activities but familiarize you with the way your customers talk about your brand.
2. Measure ROI of marketing activities
The number of comments, follower count, and the number of shares are the main metrics for most digital marketing channels. However, the amount of positive or negative discussions and comments becomes more and more important, as it impacts the reach and longevity of your marketing campaigns. Sentiment Analysis can help you measure the number of positive and negative comments after each social media post. The combination of quantitative and qualitative metrics can provide more in-depth insights for you.
3. Build stronger customer relationships
Using the same tone with your customers to communicate with them and making tangible operational improvements based on feedback will make your customers feel that you understand them and care about their feelings. They will treat you more like a person instead of a faceless company, which will make them keep choosing you over competitors.
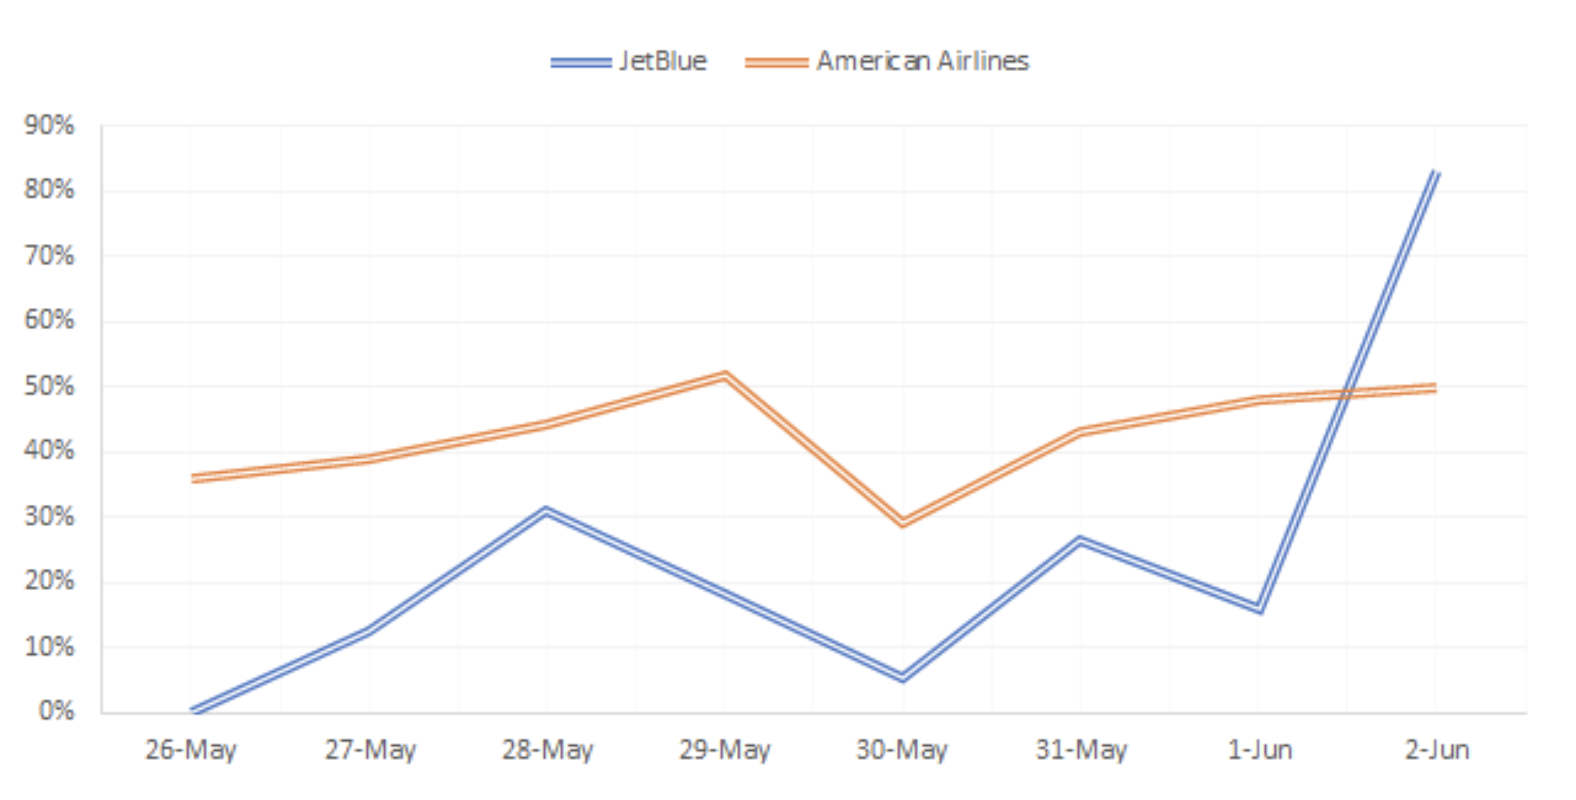
The chart below shows the ratio of the number of negative tweets to the total number of tweets each day for both American Airlines and JetBlue. This explains how negative the discussion is on Twitter surrounding the two airlines. All in all, American Airlines has a much higher percentage of negative tweets compared to JetBlue. Interestingly, the ratio of negative tweets mentioning JetBlue dramatically lifted on June 2nd. With further investigation, we found that a tweet that exposes Amber Criddle, a JetBlue employee, is a racist and is suddenly on fire on Twitter. Therefore, tons of people wrote negative tweets to JetBlue.
Use a State-of-art Pre-trained Model
Since the Naive Bayes Classifier is a basic model, the results do not meet higher accuracy requirements. Today we are glad to introduce a simple method using a pre-trained model to help you generate state-of-art sentiment analysis results.
You can use Jupyter Notebook to complete the task, but we highly recommend using Google Colab instead. Do not be surprised that below is all the code you will need.
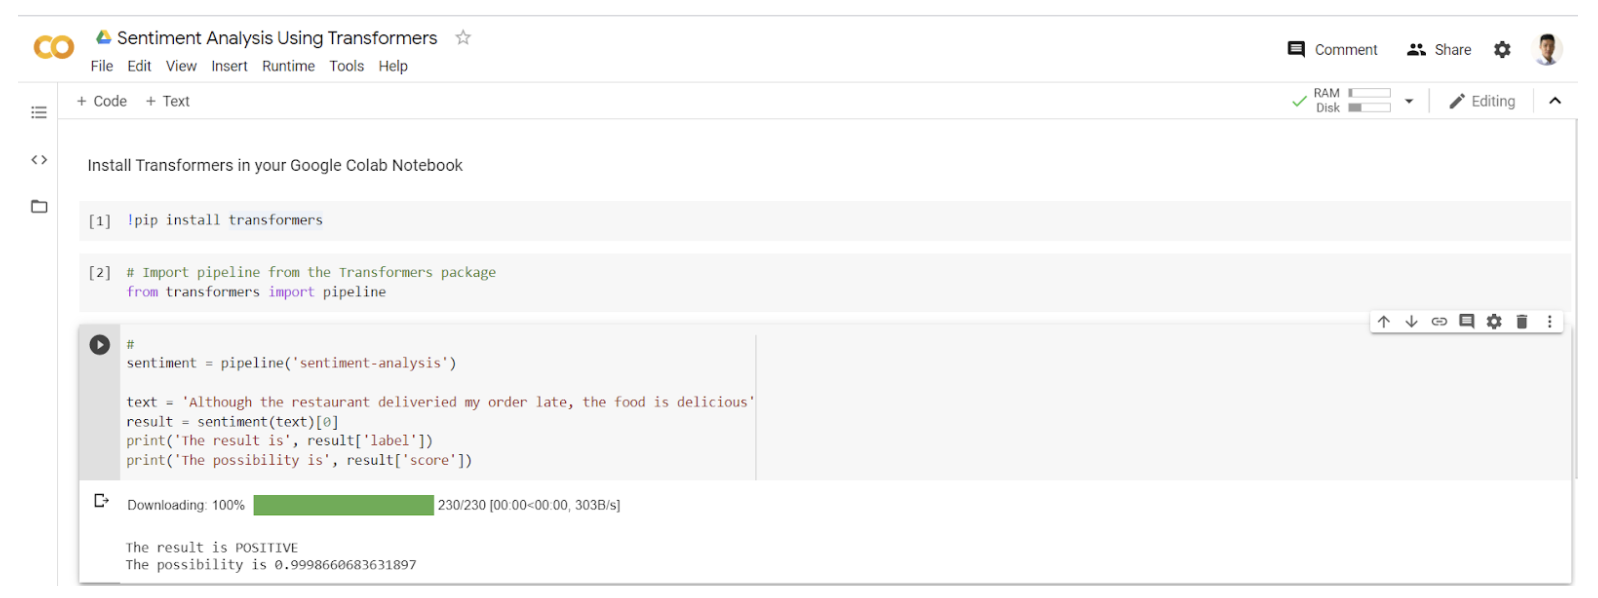
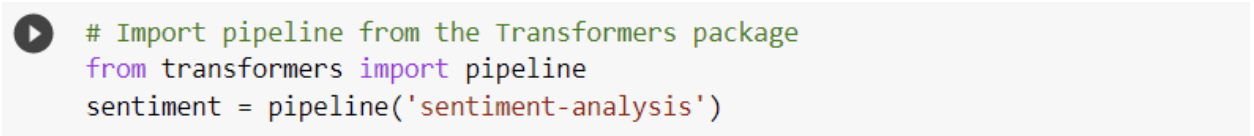
This methodology uses Transformers. Transformers (formerly known as PyTorch-transformers and PyTorch-pre-trained-BERT) provide general-purpose architectures (BERT, GPT-2, RoBERTa, XLM, DistilBert, XLNet…) for Natural Language Understanding (NLU) and Natural Language Generation (NLG) with over 32+ pre-trained models in 100+ languages and deep interoperability between TensorFlow 2.0 and PyTorch.
The pipelines are a great and easy way to use models for inference. These pipelines are objects that abstract most of the complex code from the library, offering a simple API dedicated to several tasks, including Sentiment Analysis.
You can find the code here. Let’s start:
Create a Google Colab notebook
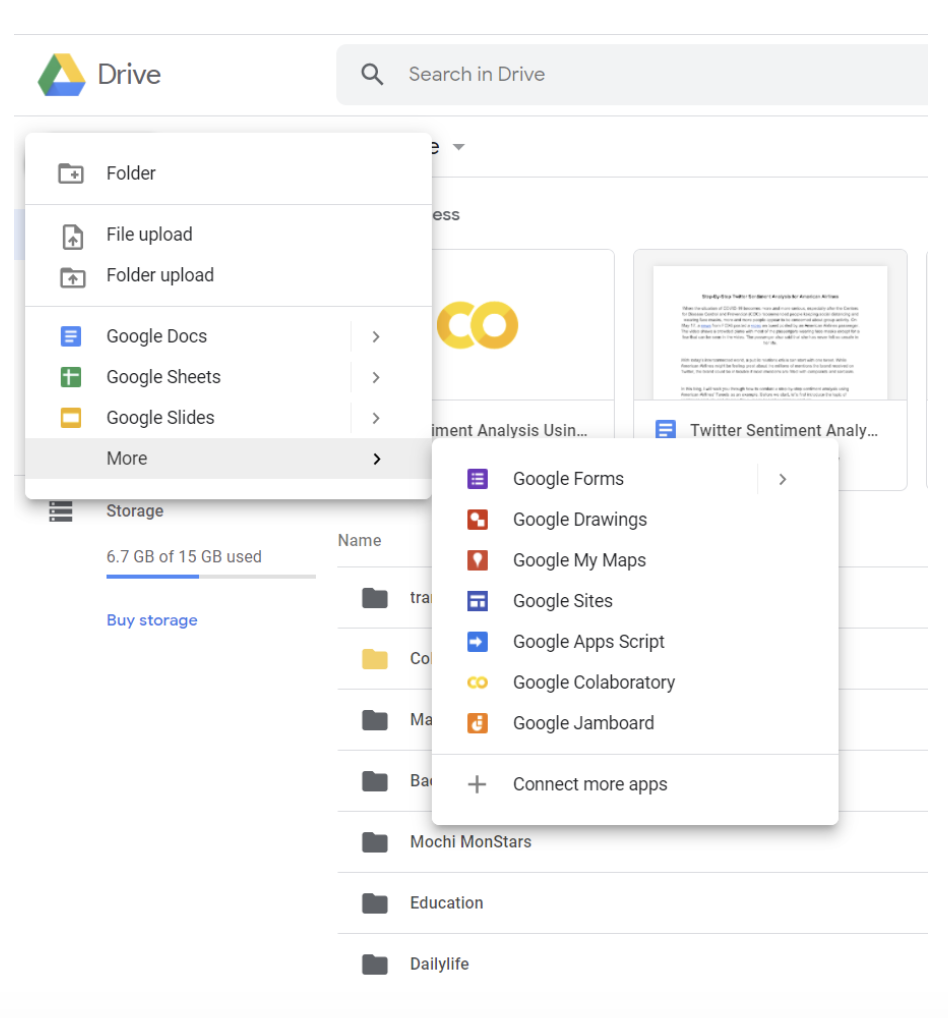
Open your Google Drive -> click the upper left button -> click Google Colaboratory in the dropdown menu
Use GPU to run your code
One of the amazing advantages of Google Colab is you can use GPU for free, which allows you to generate results much faster, especially when you deal with a complicated model or a large dataset.
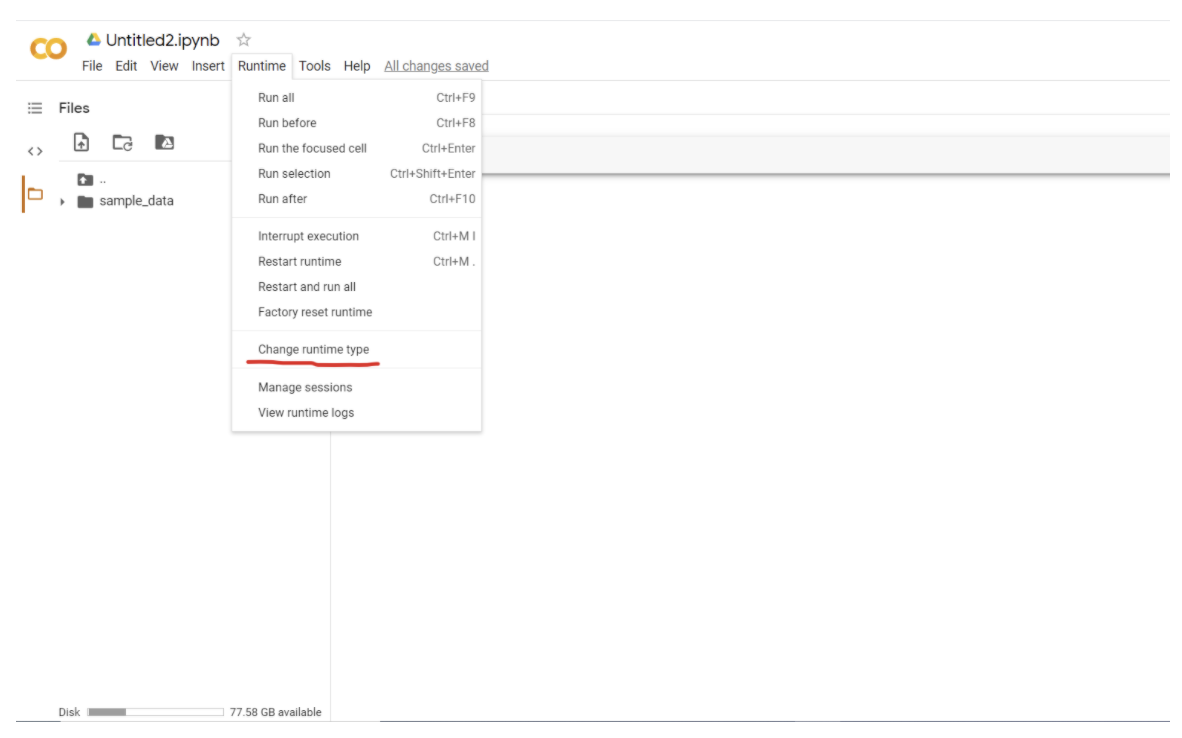
Click the Runtime button -> choose Change runtime type
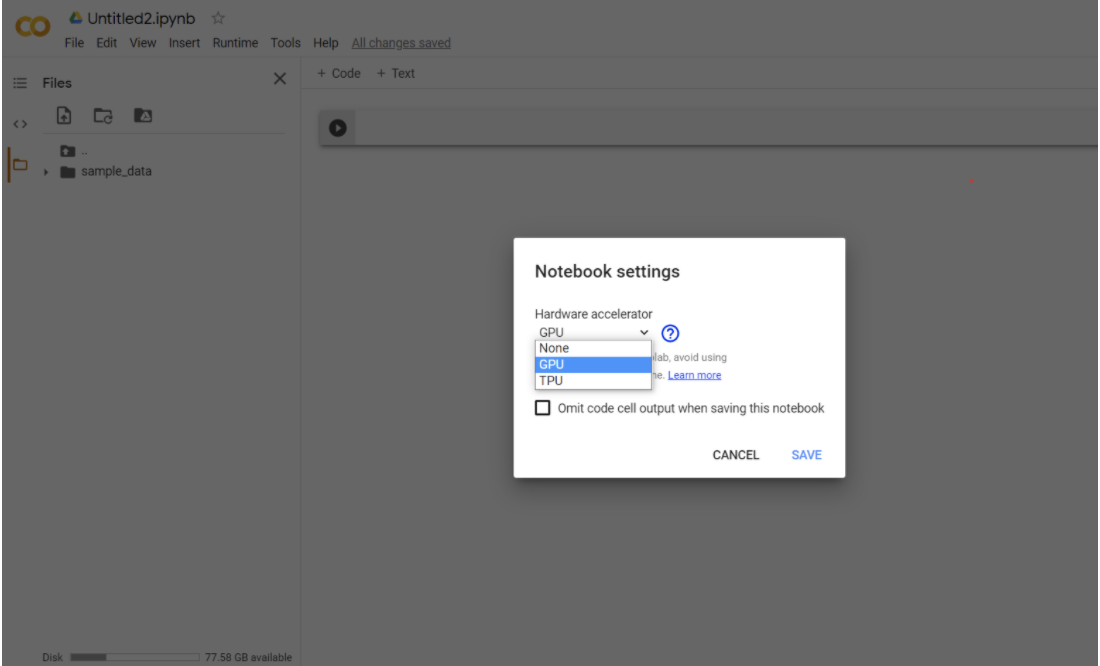
Choose GPU in the dropdown menu -> click Save
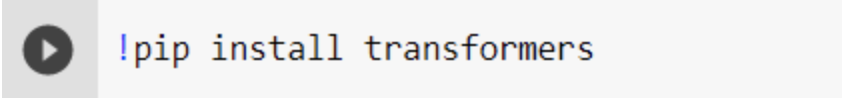
Install the Transformers library in the Colab notebook
Since the Transformers library is not preinstalled in Google Colab, the first step is to install it.
Add the sentiment analysis pipeline
Generate results

Here I used two tweets that are shown in step one.
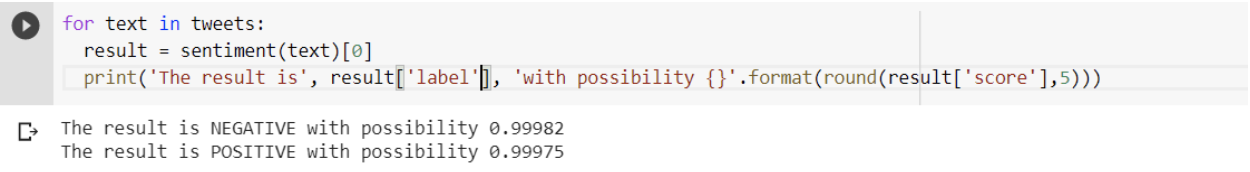
As you can see, besides sentiment results, the model provides the possibility for each result as well.
How should brands use Sentiment Analysis?
- Add sentiment analysis to the monthly marketing report
When reporting on most digital marketing channels, quantitative metrics appear to be more important, like number of followers and amount of comments. A well-designed sentiment analysis report could complement your enterprise SEO reports nicely. - Embed sentiment analysis into customer service
By calculating the word frequency of negative posts or comments on social media, we can find underlying problems with products and services that are hard to identify through regular methods. Fixing and optimizing each problem based on the results is one of the fastest ways to let customers know the company is listening to them. - Learning the voice and tone of your audience using sentiment analysis
For content creation teams, it is helpful to learn the voice and tone of the target audience by reading their posts and comments. Data analysts can not only extract posts and comments but also find out high-frequency entities (television shows, singers, etc.) mentioned in positive posts or comments using Named Entity Recognition (NER) techniques. By doing so, content creators could simulate the audience’s voice.
Here are some useful resources for building a sentiment analyzer:
- Deeply Moving: Deep Learning for Sentiment Analysis
- Learning to Classify Text
- Creating a sentiment analysis model with Scrapy and MonkeyLearn
- Detecting Sarcasm in Text
Does your Social Media Strategy need work? Let’s talk and see how iPullRank can help.
- Step-By-Step Twitter Sentiment Analysis: Visualizing Multiple Airlines’ PR Crises - April 26, 2017
- Clustering vs. Classification: How to Speed Up Your Keyword Research - January 10, 2017
- SEO Performance of the Inc 500 Travel & Hospitality Companies - September 8, 2016