MACHINE LEARNING FOR MARKETERS
A Comprehensive Guide to Machine Learning

A Comprehensive Guide to Machine Learning

Previously, we’ve already talked about the macro levels of Machine Learning (ML) which included the supervised and the unsupervised module. Additionally, we also discussed the best tools which marketers use for ML and the best way of using such tools. In this article, we’ll be talking about the models and the algorithms which stand as inner logic for all those that we’ve previously discussed.
Having a thorough knowledge on the models that build up the core of each tool will give you more options when using those tools.
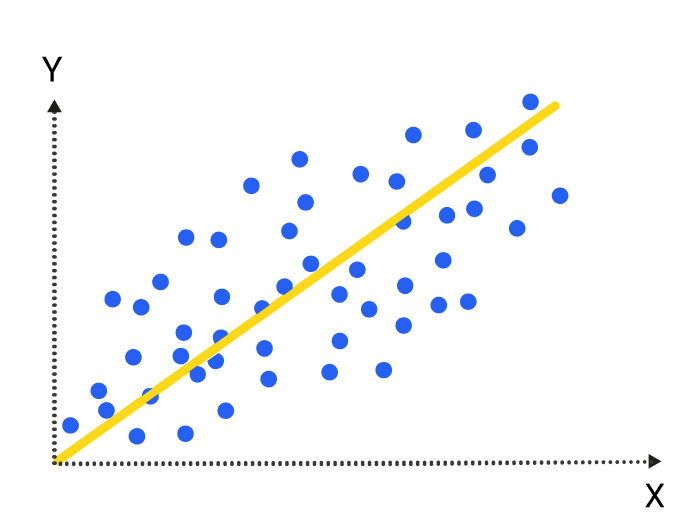
The primary task of linear relationship models is to establish the relationship between two different factors or variables. The variable or factor being predicted is the dependent variable; the factors used to predict values of the dependent variable would be the independent variables.
Establishing the relationships between dependent and independent variables is represented by the equation ya*x+b where:
y = the dependent variable
a = the slope
x = the independent variable
b = the intercept
The intercept and the slope are determined by minimizing the total sum of the square difference of the regression line and the data points.
Simplifying this formula, we can say: Linear regressions predict values through the existing variables and their relationship with one another.
A value which this particular model could have is predicting the value of possible client personas being targeted toward a new product release. As soon as you have broken down your client personas — including their buying patterns — you will be able to pull out data points which represent corresponding client personas to substitute in the linear regression equation. This arrangement will provide a precise prediction for how much a client persona may try to purchase.
The moment marketers use a linear regression as a way to estimate sales out of each persona, they can also estimate the marketing channel value to offer a better estimate on the personas for each channel. This optimization will then optimize the marketing campaign even before its launch.
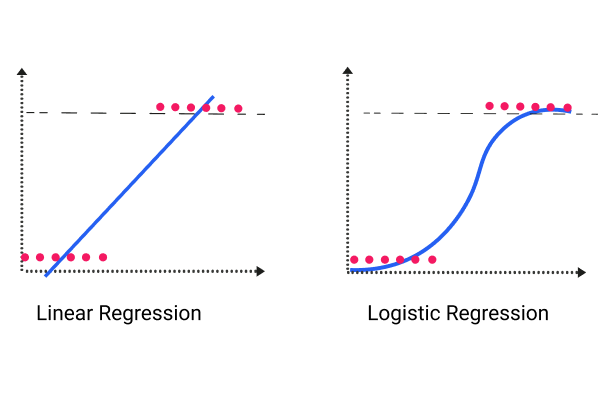
Unlike actual regression, this type of regression isn’t focused on predicting the numeric variable value through a set of inputs. Alternatively, it delivers a probability that the provided input point is coming from a specific class. In logistic regression, we are simply looking for probabilities that an event will happen.
Logistic regression focuses on the assumption that the input space could be set apart to two “regions” through a linear boundary.
The two region answers would be similar to:
True/False
Yes/No
The tools that use logistic regression within their core include Google’s prediction API along with an ML application from Amazon.
With the case mentioned earlier, we could use a logistic regression to determine if a sale has a likelihood to close, and we are able to use the linear regression to determine the amount of money which clients are likely to spend. Using this information, we can use a lead list which follows:
Linear: decides how much money a lead will be likely to spend
Logistic: determines the chances of clients spending that money
Next come up with a forecast for your overall lead list using that combination of amount and probability.
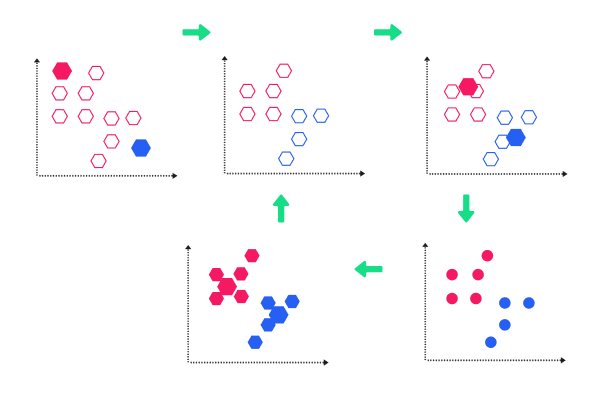
K-means is among the popular unsupervised ML algorithms designed for clustering analysis. It is a non-deterministic and iterative method. Its algorithm works over a specified data set using a predefined set of clusters, k. The result of a k-means algorithm is the k clusters of input data partitioned from the clusters.
As an example, let’s have a k-means clustering application for Wikipedia search results. We’ll use the search term Lincoln over Wikipedia. When we do, we will get results containing this word, and they usually give us references to the past U.S. president, a city in the United States, or a car company. We can use this algorithm to put these results and pages into groups which talk about the same concepts. Thus, the algorithm will group the results and pages into clusters.
A k-means clustering algorithm is commonly used by search engines to identify similarities of search results. This algorithm provides less time for the searcher when looking for a more precise result using the search engine.
A value which this particular model could have is predicting the value of possible client personas being targeted toward a new product release. As soon as you have broken down your client personas — including their buying patterns — you will be able to pull out data points which represent corresponding client personas to substitute in the linear regression equation. This arrangement will provide a precise prediction for how much a client persona may try to purchase.
The moment marketers use a linear regression as a way to estimate sales out of each persona, they can also estimate the marketing channel value to offer a better estimate on the personas for each channel. This optimization will then optimize the marketing campaign even before its launch.

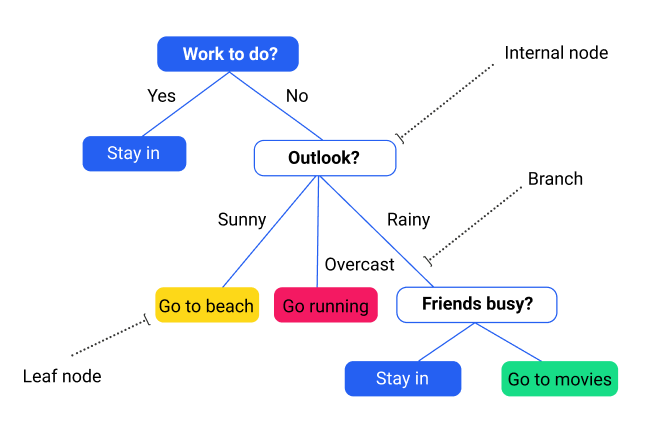
Decision trees are graphical representations which use branching methodology to deliver all possible results of a certain decision using a few specified conditions. Within a single decision tree, the particular internal node gets represented as a test over an attribute. Each corresponding branch of the tree will represent the possible outcome of the test. The leaf node represents the particular class label such as the decision made after all attributes have been compute. Classification rules will therefore be represented via the path from the root toward the leaf node.
The types of decision trees include the following:
• Classification trees: The default type of decision trees is used to set apart data sets into two varying classes using a response variable. This arrangement is generally used when a categorical nature is detected out of a response variable.
• Regression trees: This type of decision tree is used if the result or target variable will be numerical or continuous — mostly used for predictive type of issues.
Two classifications of decision trees exist, depending on the type of the target variable. These two types are composed of the binary variable decision tree and the continuous variable decision tree.
Such ML algorithms allow for reliable decisions in uncertainties and help improve communication by providing a visual representation for a decision situation. Decision-tree ML algorithms provide assistance to data scientists by capturing the idea that when one decision gets implemented, its operational nature will be something specific.
Decision-tree algorithms give developers the best decisions by letting them traverse forward and backward in a calculation path.
K-means clustering stands out to be an effective tool when developing marketing and buying personas out of clusters of information concerning buyers.
Cluster analysis proves to be useful for market segmentation. This analysis means having to divide a market’s potential customers over to different subsets wherein customers that belong to the same group are the same concerning a specified characteristic and vice versa. This arrangement will provide a convenient and more accurate marketing mix depending on the target customer specified.
Decision trees are graphical representations which use branching methodology to deliver all possible results of a certain decision using a few specified conditions. Within a single decision tree, the particular internal node gets represented as a test over an attribute. Each corresponding branch of the tree will represent the possible outcome of the test. The leaf node represents the particular class label such as the decision made after all attributes have been computed. Classification rules will therefore be represented via the path from the root toward the leaf node.
The types of decision trees include the following:
• Classification trees: The default type of decision trees is used to set apart data sets into two varying classes using a response variable. This arrangement is generally used when a categorical nature is detected out of a response variable.
• Regression trees: This type of decision tree is used if the result or target variable will be numerical or continuous — mostly used for predictive type of issues.
Two classifications of decision trees exist, depending on the type of the target variable. These two types are composed of the binary variable decision tree and the continuous variable decision tree.
Such ML algorithms allow for reliable decisions in uncertainties and help improve communication by providing a visual representation for a decision situation. Decision-tree ML algorithms provide assistance to data scientists by capturing the idea that when one decision gets implemented, its operational nature will be something specific.
Decision-tree algorithms give developers the best decisions by letting them traverse forward and backward in a calculation path.
A Sample Case in Marketing Use:
We can use decision trees referring to the various cases we’ve mentioned previously.
Regarding classification, trees get used in classification of data sets through response variables. Using this model, we are able to use the actions of historical data from previous website visitors to classify potential customers over to various lead funnel buckets.
Regression trees will then give a prediction for whether a client will make a purchase using the actions provided.
Classifying lengthy text notes is almost close to impossible when done manually. A Naïve Bayes classifier algorithm comes into place for this occasion. A classifier serves as a function which assigns a value for a population using the categories available. An example of this algorithm is the spam filtering in emails where the filter becomes a classifier that assigns an email as either spam or not spam.
This classifier is among those common learning methods grouped by similarities which makes use of Bayes’ theorem of probability to build ML models, especially those related to disease prediction and document classification. This is merely a basic classification of words that is on account of Bayes probability theorem with regards to subjective analysis of any content.
Facebook uses sentiment analysis to determine status updates showing a negative or positive emotion.
Google uses document categorization to index documents and find relevancy scores such as PageRank.
A Naïve Bayes algorithm can be used for article news classification for politics, sports, technology, and other topics.
Google also uses email spam filtering to decide whether to classify emails as spam or through the Naïve Bayes algorithm.
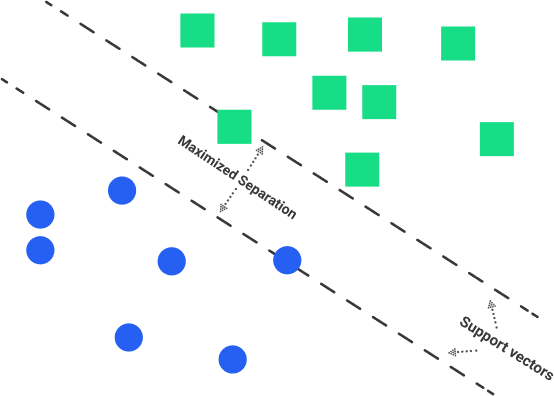
This supervised ML algorithm design is mainly for classification and regression issues in which a certain data set instructs the SVM about the classes so that it can classify fresh data sets. This classification is achieved by classifying the assigned data sets to different classes through linear hyperplanes. The SVM algorithm will try to maximize the certain distance of the different classes involved, known as margin maximization. If the line that maximizes such distance will be identified, the possibility to generalize well over unseen datasets will be increased.
The Linear SVMs tend to find a line or a hyperplane between data of two classes. For SVM, the best hyperplane is the one that maximizes the margins from both classes.
Nonlinear SVMs concern the classifiers’ inability to become separated by the hyperplane. An example of this situation is face detection which comprises a number of images composed of faces and non-faces (images other than faces). Through specific conditions, the training data becomes too complicated, becoming impossible to trace a representation for each feature vector. Having to separate the set of faces linearly through the set of non-faces is going to be a complex task.
Social Media SVMs get used to track clear mentions of a certain brand. The SVMs classify them from among other brands. Some of the metrics include loyalty, likes, and perceived value.
Through theme generation through social media, the algorithm can map social mentions over to predefined categories specific to an industry. An example of this mapping is the hospitality and travel labels which point out key themes discussed over social media regarding a company’s services or products.
Email routing SVMs automatically classify emails over clients directed to complaint handlers. This classification reduces turnaround times and offers quick solution to issues.
Opinion mining is the computational learning of the attitude of people, their opinions, and their stances on issues, companies, individuals, or services. SVMs are used to classify the polarity among texts in a document or sentence level in the classifications: negative, positive or neutral.
The artificial neuron network (ANN) serves as a computational model based over a structure and function of a biological neural network. Data which flows in the network will affect the structure of an ANN since the neural network varies — or becomes smarter in a sense — out of the output or input.

ANNS are nonlinear statistic data modeling platforms where the intricate relationships among outputs and inputs become modeled or where patterns exist.
Additionally, ANN is a neural network. The ANN comes with a few advantages; one of them is learning just by observing data sets. Using ANN as a random function approximation tool, you can estimate the cost effectiveness and best methods to arrive over a solution during the process of defining computing functions and distributions.
ANNs come with three interconnected layers. The initial layer comes with input neurons where such neurons deliver data over to the second layer and then over to a third layer.
Having to train an artificial neural network will require choosing over an allowed model in a pool of associated algorithms.
Ad targeting uses a neural network to efficiently decide where to deploy advertising spending. One example is Baidu which handles ad targeting. It launched the use of artificial neural networks.
This Chinese web giant also uses deep learning to target ads over its many lines of services. As Andrew Ng, a co-launcher of the deep learning operation of Google and Baidu’s chief research officer, “It’s used very successfully in advertising.” He further adds, “We have not released revenue numbers on the specific impact, but it is significant.”
Your model selection will be decided by the data you are working with, the tools your team utilizes, and the questions you are trying to answer. As you can see, an ML model is not a one size fits all tool. Luckily for marketers the decision of what model fits with which activity is being made by Machine Learning and AI tool developers that are making it easier for professionals across occupations to deliver results using data science.
![]()
![]()
Previously, we’ve already talked about the macro levels of Machine Learning (ML) which included the supervised and the unsupervised module. Additionally, we also discussed the best tools which marketers use for ML and the best way of using such tools. In this article, we’ll be talking about the models and the algorithms which stand as inner logic for all those that we’ve previously discussed.
Having a thorough knowledge on the models that build up the core of each tool will give you more options when using those tools.
The primary task of linear relationship models is to establish the relationship between two different factors or variables. The variable or factor being predicted is the dependent variable; the factors used to predict values of the dependent variable would be the independent variables.
Establishing the relationships between dependent and independent variables is represented by the equation ya*x+b where:
y = the dependent variable
a = the slope
x = the independent variable
b = the intercept
The intercept and the slope are determined by minimizing the total sum of the square difference of the regression line and the data points.
Simplifying this formula, we can say: Linear regressions predict values through the existing variables and their relationship with one another.
A value which this particular model could have is predicting the value of possible client personas being targeted toward a new product release. As soon as you have broken down your client personas — including their buying patterns — you will be able to pull out data points which represent corresponding client personas to substitute in the linear regression equation. This arrangement will provide a precise prediction for how much a client persona may try to purchase.
The moment marketers use a linear regression as a way to estimate sales out of each persona, they can also estimate the marketing channel value to offer a better estimate on the personas for each channel. This optimization will then optimize the marketing campaign even before its launch.
Unlike actual regression, this type of regression isn’t focused on predicting the numeric variable value through a set of inputs. Alternatively, it delivers a probability that the provided input point is coming from a specific class. In logistic regression, we are simply looking for probabilities that an event will happen.
Logistic regression focuses on the assumption that the input space could be set apart to two “regions” through a linear boundary.
The two region answers would be similar to:
True/False
Yes/No
The tools that use logistic regression within their core include Google’s prediction API along with an ML application from Amazon.
With the case mentioned earlier, we could use a logistic regression to determine if a sale has a likelihood to close, and we are able to use the linear regression to determine the amount of money which clients are likely to spend. Using this information, we can use a lead list which follows:
Linear: decides how much money a lead will be likely to spend
Logistic: determines the chances of clients spending that money
Next come up with a forecast for your overall lead list using that combination of amount and probability.
K-means is among the popular unsupervised ML algorithms designed for clustering analysis. It is a non-deterministic and iterative method. Its algorithm works over a specified data set using a predefined set of clusters, k. The result of a k-means algorithm is the k clusters of input data partitioned from the clusters.
As an example, let’s have a k-means clustering application for Wikipedia search results. We’ll use the search term Lincoln over Wikipedia. When we do, we will get results containing this word, and they usually give us references to the past U.S. president, a city in the United States, or a car company. We can use this algorithm to put these results and pages into groups which talk about the same concepts. Thus, the algorithm will group the results and pages into clusters.
A k-means clustering algorithm is commonly used by search engines to identify similarities of search results. This algorithm provides less time for the searcher when looking for a more precise result using the search engine.
A value which this particular model could have is predicting the value of possible client personas being targeted toward a new product release. As soon as you have broken down your client personas — including their buying patterns — you will be able to pull out data points which represent corresponding client personas to substitute in the linear regression equation. This arrangement will provide a precise prediction for how much a client persona may try to purchase.
The moment marketers use a linear regression as a way to estimate sales out of each persona, they can also estimate the marketing channel value to offer a better estimate on the personas for each channel. This optimization will then optimize the marketing campaign even before its launch.
Decision trees are graphical representations which use branching methodology to deliver all possible results of a certain decision using a few specified conditions. Within a single decision tree, the particular internal node gets represented as a test over an attribute. Each corresponding branch of the tree will represent the possible outcome of the test. The leaf node represents the particular class label such as the decision made after all attributes have been compute. Classification rules will therefore be represented via the path from the root toward the leaf node.
The types of decision trees include the following:
• Classification trees: The default type of decision trees is used to set apart data sets into two varying classes using a response variable. This arrangement is generally used when a categorical nature is detected out of a response variable.
• Regression trees: This type of decision tree is used if the result or target variable will be numerical or continuous — mostly used for predictive type of issues.
Two classifications of decision trees exist, depending on the type of the target variable. These two types are composed of the binary variable decision tree and the continuous variable decision tree.
Such ML algorithms allow for reliable decisions in uncertainties and help improve communication by providing a visual representation for a decision situation. Decision-tree ML algorithms provide assistance to data scientists by capturing the idea that when one decision gets implemented, its operational nature will be something specific.
Decision-tree algorithms give developers the best decisions by letting them traverse forward and backward in a calculation path.
K-means clustering stands out to be an effective tool when developing marketing and buying personas out of clusters of information concerning buyers.
Cluster analysis proves to be useful for market segmentation. This analysis means having to divide a market’s potential customers over to different subsets wherein customers that belong to the same group are the same concerning a specified characteristic and vice versa. This arrangement will provide a convenient and more accurate marketing mix depending on the target customer specified.
Decision trees are graphical representations which use branching methodology to deliver all possible results of a certain decision using a few specified conditions. Within a single decision tree, the particular internal node gets represented as a test over an attribute. Each corresponding branch of the tree will represent the possible outcome of the test. The leaf node represents the particular class label such as the decision made after all attributes have been computed. Classification rules will therefore be represented via the path from the root toward the leaf node.
The types of decision trees include the following:
• Classification trees: The default type of decision trees is used to set apart data sets into two varying classes using a response variable. This arrangement is generally used when a categorical nature is detected out of a response variable.
• Regression trees: This type of decision tree is used if the result or target variable will be numerical or continuous — mostly used for predictive type of issues.
Two classifications of decision trees exist, depending on the type of the target variable. These two types are composed of the binary variable decision tree and the continuous variable decision tree.
Such ML algorithms allow for reliable decisions in uncertainties and help improve communication by providing a visual representation for a decision situation. Decision-tree ML algorithms provide assistance to data scientists by capturing the idea that when one decision gets implemented, its operational nature will be something specific.
Decision-tree algorithms give developers the best decisions by letting them traverse forward and backward in a calculation path.
A Sample Case in Marketing Use:
We can use decision trees referring to the various cases we’ve mentioned previously.
Regarding classification, trees get used in classification of data sets through response variables. Using this model, we are able to use the actions of historical data from previous website visitors to classify potential customers over to various lead funnel buckets.
Regression trees will then give a prediction for whether a client will make a purchase using the actions provided.
Classifying lengthy text notes is almost close to impossible when done manually. A Naïve Bayes classifier algorithm comes into place for this occasion. A classifier serves as a function which assigns a value for a population using the categories available. An example of this algorithm is the spam filtering in emails where the filter becomes a classifier that assigns an email as either spam or not spam.
This classifier is among those common learning methods grouped by similarities which makes use of Bayes’ theorem of probability to build ML models, especially those related to disease prediction and document classification. This is merely a basic classification of words that is on account of Bayes probability theorem with regards to subjective analysis of any content.
Facebook uses sentiment analysis to determine status updates showing a negative or positive emotion.
Google uses document categorization to index documents and find relevancy scores such as PageRank.
A Naïve Bayes algorithm can be used for article news classification for politics, sports, technology, and other topics.
Google also uses email spam filtering to decide whether to classify emails as spam or through the Naïve Bayes algorithm.
This supervised ML algorithm design is mainly for classification and regression issues in which a certain data set instructs the SVM about the classes so that it can classify fresh data sets. This classification is achieved by classifying the assigned data sets to different classes through linear hyperplanes. The SVM algorithm will try to maximize the certain distance of the different classes involved, known as margin maximization. If the line that maximizes such distance will be identified, the possibility to generalize well over unseen datasets will be increased.
The Linear SVMs tend to find a line or a hyperplane between data of two classes. For SVM, the best hyperplane is the one that maximizes the margins from both classes.
Nonlinear SVMs concern the classifiers’ inability to become separated by the hyperplane. An example of this situation is face detection which comprises a number of images composed of faces and non-faces (images other than faces). Through specific conditions, the training data becomes too complicated, becoming impossible to trace a representation for each feature vector. Having to separate the set of faces linearly through the set of non-faces is going to be a complex task.
Social Media SVMs get used to track clear mentions of a certain brand. The SVMs classify them from among other brands. Some of the metrics include loyalty, likes, and perceived value.
Through theme generation through social media, the algorithm can map social mentions over to predefined categories specific to an industry. An example of this mapping is the hospitality and travel labels which point out key themes discussed over social media regarding a company’s services or products.
Email routing SVMs automatically classify emails over clients directed to complaint handlers. This classification reduces turnaround times and offers quick solution to issues.
Opinion mining is the computational learning of the attitude of people, their opinions, and their stances on issues, companies, individuals, or services. SVMs are used to classify the polarity among texts in a document or sentence level in the classifications: negative, positive or neutral.
The artificial neuron network (ANN) serves as a computational model based over a structure and function of a biological neural network. Data which flows in the network will affect the structure of an ANN since the neural network varies — or becomes smarter in a sense — out of the output or input.
ANNS are nonlinear statistic data modeling platforms where the intricate relationships among outputs and inputs become modeled or where patterns exist.
Additionally, ANN is a neural network. The ANN comes with a few advantages; one of them is learning just by observing data sets. Using ANN as a random function approximation tool, you can estimate the cost effectiveness and best methods to arrive over a solution during the process of defining computing functions and distributions.
ANNs come with three interconnected layers. The initial layer comes with input neurons where such neurons deliver data over to the second layer and then over to a third layer.
Having to train an artificial neural network will require choosing over an allowed model in a pool of associated algorithms.
Ad targeting uses a neural network to efficiently decide where to deploy advertising spending. One example is Baidu which handles ad targeting. It launched the use of artificial neural networks.
This Chinese web giant also uses deep learning to target ads over its many lines of services. As Andrew Ng, a co-launcher of the deep learning operation of Google and Baidu’s chief research officer, “It’s used very successfully in advertising.” He further adds, “We have not released revenue numbers on the specific impact, but it is significant.”
Your model selection will be decided by the data you are working with, the tools your team utilizes, and the questions you are trying to answer. As you can see, an ML model is not a one size fits all tool. Luckily for marketers the decision of what model fits with which activity is being made by Machine Learning and AI tool developers that are making it easier for professionals across occupations to deliver results using data science.
![]()
![]()