MACHINE LEARNING FOR MARKETERS
A Comprehensive Guide to Machine Learning
A certain notion exists that Machine Learning is only for the experts and is not for people with less knowledge of programming. The people you’ll be dealing with are machines, and machines can’t make decisions on their own. Your job is to make these machines think. At first, you would think that this task is impossible, but through this guide, you’ll understand how Machine Learning can be much easier than it sounds.
As with almost every framework in the history of humankind — along the lines of Newton’s laws of motion, the law of supply and demand, and others — the particular ideas and concepts of Machine Learning are likewise achievable and not complicated. Among those challenges that you can face when discovering Machine Learning are the notations, formulas, and a specific language which you may have never heard about before.
Just about any data set can be used for Machine Learning purposes, but an efficient model can only be achieved through a well-structured data set.
When thinking about data sets, the better data sets with well-labeled data that features a number of Machine Learning algorithms mean you won’t have a hard time building your model. However, coming up with simpler algorithms is best despite the volume, especially when you’re dealing with a number of data sets, for easier sorting later on. As an example, regularized logistic regression using billions of features can work well despite the substantial numbers.
The more complicated algorithms — which include GBRT (Gradient Boosted Regression Tree), deep neural networks, and random forests — perform better than simpler platforms; however, they can be more expensive to use and train. When you’re working with tons of data, you will always make use of linear perceptron and other learning algorithms online. When using any learning algorithms online, you always need to use a stochastic gradient descent.
Perhaps always choosing a good selection of features would be safe, such as the essential tools to learn about your data. Also a features selection serves more likely an art instead of a science. The selection process could be complicated; however, it could be eased out if you work on removing the unpromising ones first to narrow down your options.

To find the best model that suits your needs, you need to keep in mind a few of the following considerations:
While accuracy is important, you don’t always have to go with the most accurate answer. This can happen when you feel that you have a model that is producing a high bias or high variance. Sometimes an approximation will do depending on the use. Opting for the approximation, you’ll be able to reduce processing time and you avoid overfitting.
Each algorithm will require varying training times for instructing its models. As we consider the train- ing time, we should note that this time is closely related to the accuracy — as training time increases, so does the accuracy. Also keep in mind that other algorithms can be more sensitive than others and may require more training time.
Linearity is common in Machine Learning algorithms. A line can possibly separate classes as assumed by linear classification algorithms. These classes can be composed of support vector and logistic regression machines. Linear classification algorithms work off of assumptions which can lead to the previously mentioned high bias and variance issues. These algorithms are still commonly implemented first because they’re algorithmically simple and quick to train.
Data scientists use precise measurements to set up an algorithm called parameters. These parameters are in the form of numbers which provide changes on the behavior of algorithms. These behavioral changes can include the number of iterations, error tolerances, or options among variants about the behavior of algorithms. Sometimes, if you want to have the best settings, you may often need to adjust the accuracy and the training time. The algorithms having the largest number of parameters will always require more trial-and-error combinations and tests.
A substantial amount of repetition will always be required with training a model to achieve a high level of accuracy out of a selected model.
As a first step, you’ll have to select the best model suited for your particular project. Previously, we discussed the pros and cons for various models. With the information provided, the steps would cover the following:
Data Set Partitioning for Testing and Training:
Also called the process of “data partitioning,” you’ll find various options from the variety of tools and languages to help you choose which data points to divide over training and testing data sets.
If you are using Python, you can simply import the train_test_split package from scikit-learn library and choose how many percent of your data needs for training.

For people who use R, below is an example of partitioning data sets.

Cross validation (CV) is used to evaluate the effectiveness of Machine Learning models and train a model if we have limited data. When we talk about Cross Validation, we mean K-Folds Cross Validation most of the time.
K-Fold randomly splits a dataset into k folds, and it uses k-1 (k minus 1) for training and kth fold for validation. It repeats this process until every K-fold serves as a test set, and then takes the average of recorded scores.
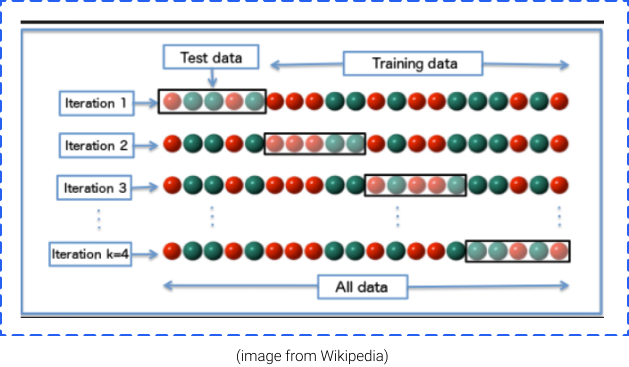
Therefore, CV can give you a guarantee for an accurately correct model that doesn’t pick too much noise or, in simpler terms, low on variance and bias. Cross-validation becomes a reliable technique if you want to track the effectiveness of your particular model especially within cases where you need to ease overfitting.
Using the data provided after a cross-validation process, let’s check out the errors and devise a way to fix these errors.
When on the lookout for the basic data sets to learn with and gain comfort with, experts would recommend multivariate data sets provided by Ronald Fisher, a British statistician who, in 1936, introduced the Iris Flower Data Set. This data set studied four measured features across three different species of iris. It comes with 50 samples for every species.
Moving on to the next steps as soon as we acquire our data set:
First, let’s open your KNIME Analytics Platform, and create a new workflow.
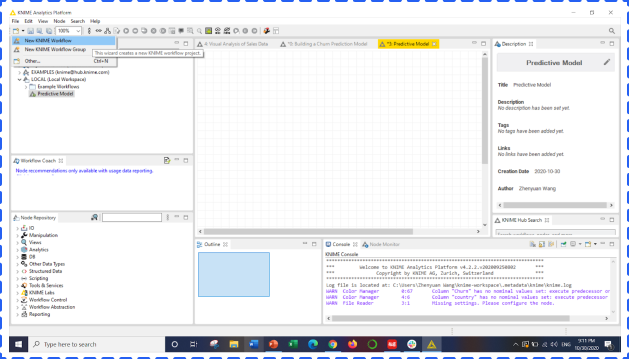
The upper left window, KNIME Explorer, shows all your projects (workflows) and related datasets. From the bottom left, you could find all tools that you will need to build a model. KNIME includes almost all machine learning models you probably use in daily work, such as Clustering, Neural Network, and Linear Regression.
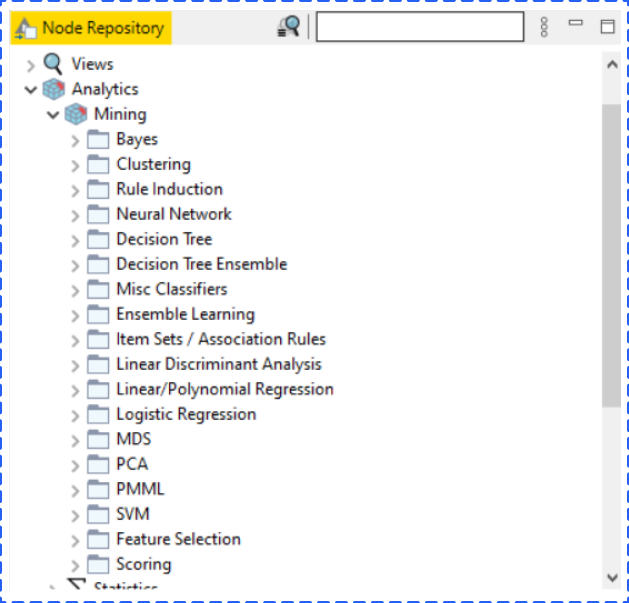
When we are familiar with the platform, let’s build the model. One of KNIME advantages is you can not only drag a node from the Node Repository, but drag a data file directly from your local folder to the platform. And KNIME will automatically identify and read your file. In this example, we used the iris dataset.
After dragging the file to KNIME, you could check the information of the dataset from a popup window. Click OK if everything is correct.
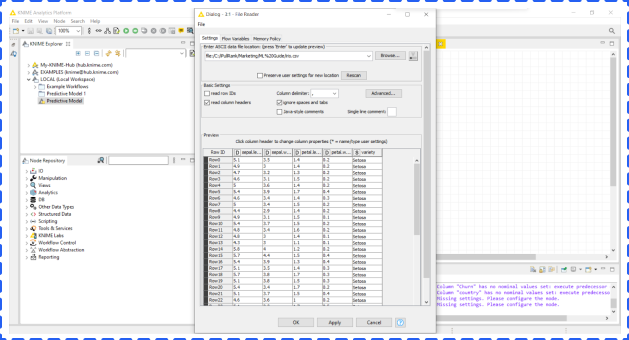
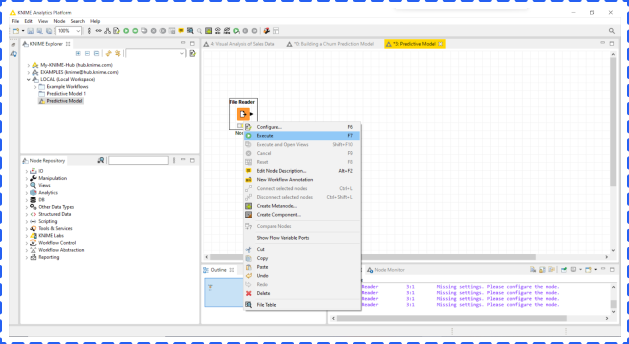
After back to the main screen, right click File Node and choose Execute to finish importing the dataset.
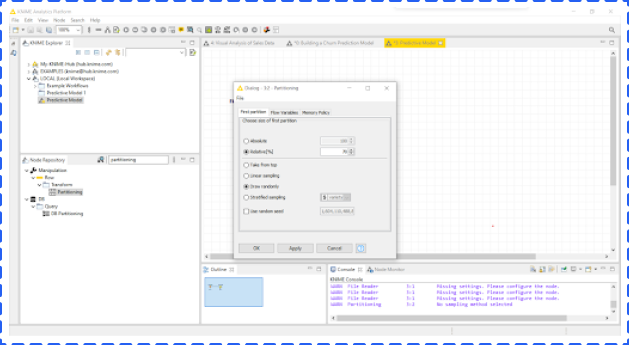
Next, you need to partition the dataset into training and testing datasets, and the percentage of training could be changed in the Relative option. In this example, we chose 70% for training and 30% for testing.
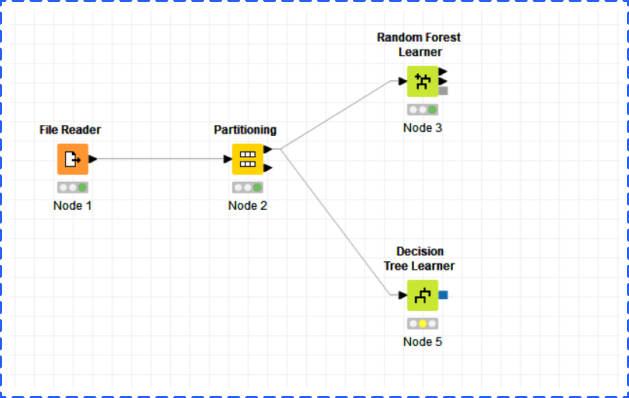
After partitioning the dataset into training and testing, the next step is to choose appropriate models for training. You could find all models by clicking Analytics and Mining in the Node Repository. In this example, we chose Decision Tree and Random Forest. Remember to use the upper arrow to connect each learner node which means using training data only.
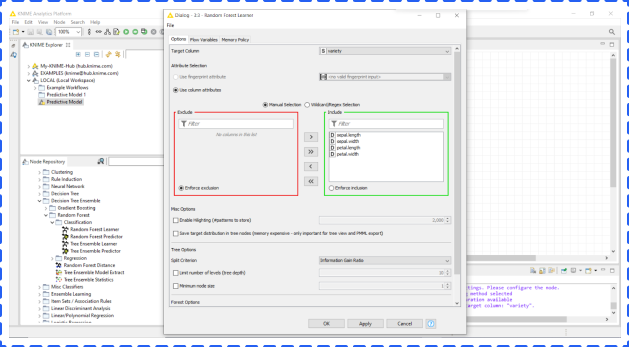
Before executing model nodes, you should check the parameter setting for each model by right clicking a model node and choosing the configure option. In this window, you could change the dependent variable (target column) and independent variables. Click OK when you finish.
After executing each learner node to complete training, you should add corresponding predictors to each learner and connect each predictor node with both learner node and partitioning node.
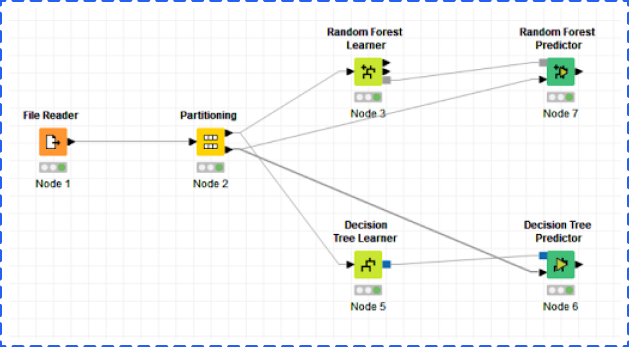
After executing, right clicking a scorer node and choosing Accuracy Statistics option. A new window will pop up. From the table, you could find the accuracy of our Random Forest model is 97.8%. Great job!

In this example, we only show you some basic projective models with a simple workflow, but KNIME definitely allows you to build more advanced models with a complex workflow.
At iPullRank, one of the fundamentals we focus on are our three C’s: Customers, Content, and Components. Each is equally important and every strategy that we create focuses uniquely on all three.
A main focus of each of our strategies is marketing segmentation in relation to Organic Search. Understanding your customers is paramount in a successful SEO campaign.
At iPullRank, we aim for nothing less than 10x content every time. This means each piece of content, be it a blog post, infographic, or even interactive, must provide 10x the value of what can be found elsewhere.
Finally, the technical aspect of each of our deliverables is unmatched and everything is backed up by data.
We have worked with dozens of enterprise companies and have helped drive more than $1 billion in incremental revenue since iPullRank was founded in 2014.
If you feel ready to make an informed decision on the importance of SEO and its value for enterprise businesses, contact our team of expert SEOs, Content Strategists, Analysts, and Marketers to find out how we can help you get the results you need.
iPullRank is an agile, results-focused digital marketing agency specializing in SEO, Content Strategy, Solutions Architecture, Marketing Automation, Social Media, Measurement and Optimization. We are based in New York City and work with local and international clients to create work we can be PROUD of.
For more insights on the future of SEO, take a look at the other resources we offer including our 50 Techniques and Forecasting and Prediction ROI on SEO or contact iPullRank for expert SEO advice on how to reach your business goal.
A certain notion exists that Machine Learning is only for the experts and is not for people with less knowledge of programming. The people you’ll be dealing with are machines, and machines can’t make decisions on their own. Your job is to make these machines think. At first, you would think that this task is impossible, but through this guide, you’ll understand how Machine Learning can be much easier than it sounds.
As with almost every framework in the history of humankind — along the lines of Newton’s laws of motion, the law of supply and demand, and others — the particular ideas and concepts of Machine Learning are likewise achievable and not complicated. Among those challenges that you can face when discovering Machine Learning are the notations, formulas, and a specific language which you may have never heard about before.
Just about any data set can be used for Machine Learning purposes, but an efficient model can only be achieved through a well-structured data set.
When thinking about data sets, the better data sets with well-labeled data that features a number of Machine Learning algorithms mean you won’t have a hard time building your model. However, coming up with simpler algorithms is best despite the volume, especially when you’re dealing with a number of data sets, for easier sorting later on. As an example, regularized logistic regression using billions of features can work well despite the substantial numbers.
The more complicated algorithms — which include GBRT (Gradient Boosted Regression Tree), deep neural networks, and random forests — perform better than simpler platforms; however, they can be more expensive to use and train. When you’re working with tons of data, you will always make use of linear perceptron and other learning algorithms online. When using any learning algorithms online, you always need to use a stochastic gradient descent.
Perhaps always choosing a good selection of features would be safe, such as the essential tools to learn about your data. Also a features selection serves more likely an art instead of a science. The selection process could be complicated; however, it could be eased out if you work on removing the unpromising ones first to narrow down your options.

To find the best model that suits your needs, you need to keep in mind a few of the following considerations:
While accuracy is important, you don’t always have to go with the most accurate answer. This can happen when you feel that you have a model that is producing a high bias or high variance. Sometimes an approximation will do depending on the use. Opting for the approximation, you’ll be able to reduce processing time and you avoid overfitting.
Each algorithm will require varying training times for instructing its models. As we consider the train- ing time, we should note that this time is closely related to the accuracy — as training time increases, so does the accuracy. Also keep in mind that other algorithms can be more sensitive than others and may require more training time.
Linearity is common in Machine Learning algorithms. A line can possibly separate classes as assumed by linear classification algorithms. These classes can be composed of support vector and logistic regression machines. Linear classification algorithms work off of assumptions which can lead to the previously mentioned high bias and variance issues. These algorithms are still commonly implemented first because they’re algorithmically simple and quick to train.
Data scientists use precise measurements to set up an algorithm called parameters. These parameters are in the form of numbers which provide changes on the behavior of algorithms. These behavioral changes can include the number of iterations, error tolerances, or options among variants about the behavior of algorithms. Sometimes, if you want to have the best settings, you may often need to adjust the accuracy and the training time. The algorithms having the largest number of parameters will always require more trial-and-error combinations and tests.
A substantial amount of repetition will always be required with training a model to achieve a high level of accuracy out of a selected model.
As a first step, you’ll have to select the best model suited for your particular project. Previously, we discussed the pros and cons for various models. With the information provided, the steps would cover the following:
Data Set Partitioning for Testing and Training:
Also called the process of “data partitioning,” you’ll find various options from the variety of tools and languages to help you choose which data points to divide over training and testing data sets.
If you are using Python, you can simply import the train_test_split package from scikit-learn library and choose how many percent of your data needs for training.

For people who use R, below is an example of partitioning data sets.

Cross validation (CV) is used to evaluate the effectiveness of Machine Learning models and train a model if we have limited data. When we talk about Cross Validation, we mean K-Folds Cross Validation most of the time.
K-Fold randomly splits a dataset into k folds, and it uses k-1 (k minus 1) for training and kth fold for validation. It repeats this process until every K-fold serves as a test set, and then takes the average of recorded scores.

Therefore, CV can give you a guarantee for an accurately correct model that doesn’t pick too much noise or, in simpler terms, low on variance and bias. Cross-validation becomes a reliable technique if you want to track the effectiveness of your particular model especially within cases where you need to ease overfitting.
Using the data provided after a cross-validation process, let’s check out the errors and devise a way to fix these errors.
When on the lookout for the basic data sets to learn with and gain comfort with, experts would recommend multivariate data sets provided by Ronald Fisher, a British statistician who, in 1936, introduced the Iris Flower Data Set. This data set studied four measured features across three different species of iris. It comes with 50 samples for every species.
Moving on to the next steps as soon as we acquire our data set:
First, let’s open your KNIME Analytics Platform, and create a new workflow.

The upper left window, KNIME Explorer, shows all your projects (workflows) and related datasets. From the bottom left, you could find all tools that you will need to build a model. KNIME includes almost all machine learning models you probably use in daily work, such as Clustering, Neural Network, and Linear Regression.

When we are familiar with the platform, let’s build the model. One of KNIME advantages is you can not only drag a node from the Node Repository, but drag a data file directly from your local folder to the platform. And KNIME will automatically identify and read your file. In this example, we used the iris dataset.
After dragging the file to KNIME, you could check the information of the dataset from a popup window. Click OK if everything is correct.

After back to the main screen, right click File Node and choose Execute to finish importing the dataset.

Next, you need to partition the dataset into training and testing datasets, and the percentage of training could be changed in the Relative option. In this example, we chose 70% for training and 30% for testing.

After partitioning the dataset into training and testing, the next step is to choose appropriate models for training. You could find all models by clicking Analytics and Mining in the Node Repository. In this example, we chose Decision Tree and Random Forest. Remember to use the upper arrow to connect each learner node which means using training data only.

Before executing model nodes, you should check the parameter setting for each model by right clicking a model node and choosing the configure option. In this window, you could change the dependent variable (target column) and independent variables. Click OK when you finish.

After executing each learner node to complete training, you should add corresponding predictors to each learner and connect each predictor node with both learner node and partitioning node.

After executing, right clicking a scorer node and choosing Accuracy Statistics option. A new window will pop up. From the table, you could find the accuracy of our Random Forest model is 97.8%. Great job!

In this example, we only show you some basic projective models with a simple workflow, but KNIME definitely allows you to build more advanced models with a complex workflow.
At iPullRank, one of the fundamentals we focus on are our three C’s: Customers, Content, and Components. Each is equally important and every strategy that we create focuses uniquely on all three.
A main focus of each of our strategies is marketing segmentation in relation to Organic Search. Understanding your customers is paramount in a successful SEO campaign.
At iPullRank, we aim for nothing less than 10x content every time. This means each piece of content, be it a blog post, infographic, or even interactive, must provide 10x the value of what can be found elsewhere.
Finally, the technical aspect of each of our deliverables is unmatched and everything is backed up by data.
We have worked with dozens of enterprise companies and have helped drive more than $1 billion in incremental revenue since iPullRank was founded in 2014.
If you feel ready to make an informed decision on the importance of SEO and its value for enterprise businesses, contact our team of expert SEOs, Content Strategists, Analysts, and Marketers to find out how we can help you get the results you need.
iPullRank is an agile, results-focused digital marketing agency specializing in SEO, Content Strategy, Solutions Architecture, Marketing Automation, Social Media, Measurement and Optimization. We are based in New York City and work with local and international clients to create work we can be PROUD of.
For more insights on the future of SEO, take a look at the other resources we offer including our 50 Techniques and Forecasting and Prediction ROI on SEO or contact iPullRank for expert SEO advice on how to reach your business goal.