
A little over a year ago, the brilliant AJ Kohn wrote a post called My Favorite SEO Tool Isn’t An SEO Tool wherein he spoke at length about some of the features of Chrome Developer Tools that he gets a lot of mileage out of. Initially, I thought to myself, yeah DevTools is great, but it’s not going to scale for the types of things that I’m doing across hundreds, thousands and millions of pages. However, as we’ve continued to go through a technical renaissance in SEO over the past year, I’ve started to realize how far behind our SEO tools are from what Google supports and has provided.
From the outside looking in, it seems that the SEO tool companies have been in an arms race to get more and more of the content marketer’s budget. While that’s been happening, they’ve neglected to keep up with Google’s specs. In other words, innovations have been focused in areas that speak to a broader marketer’s content and social measurement problems rather than on the technical SEO side of things. For instance, Google allows a number of directives such rel-canonical, x-robots and hreflang to be specified in the header response for a given URL and, to my knowledge, most popular crawling tools, aren’t looking for that (DeepCrawl looks for x-robots and URLProfiler looks for rel-canonical and x-robots). Another example is that, Google’s spec for mobile mentions that Google will account for client side redirects, what tool do we have that allows us to account for that?
Google continues to make pushes for speed and, by default, Chrome DevTools has a lot of features that help you dig deeper into the components of the page that contribute to page load time. So let’s talk about the parts of DevTools that I get a ton of value from. I also encourage you to check out AJ’s post as he walks you through what he uses it for as well.
Before we get into it, you should consider, if only to have a clean browser that’s not running in Incognito mode, downloading Chrome Canary. Chrome Canary is the latest version of Chrome, released daily, with all the brand new features. Similarly, for those of you still using Firefox, the Firefox Developer Version give you more features for debugging as well.
Inspect Element
First things first, View Source, we’ve had great times together, but it’s over. In the post-JavaScript age, there is little value in looking at the pure source code of a page before its JavaScript transformations. In fact, due to Google’s vast improvements in crawling, this is a fundamental flaw of all SEO crawling tools in that crawlers are not seeing the code as the user or Google sees it. Rather, SEO tools are seeing the code as it’s downloaded and not as it’s rendered. Granted, crawling with headless browsers is both slower and far more computationally expensive, but it’s also just a requirement at this point given the adoption rate of JavaScript frameworks. If you’re not using Inspect Element to review code, you are likely missing a big part of the picture.
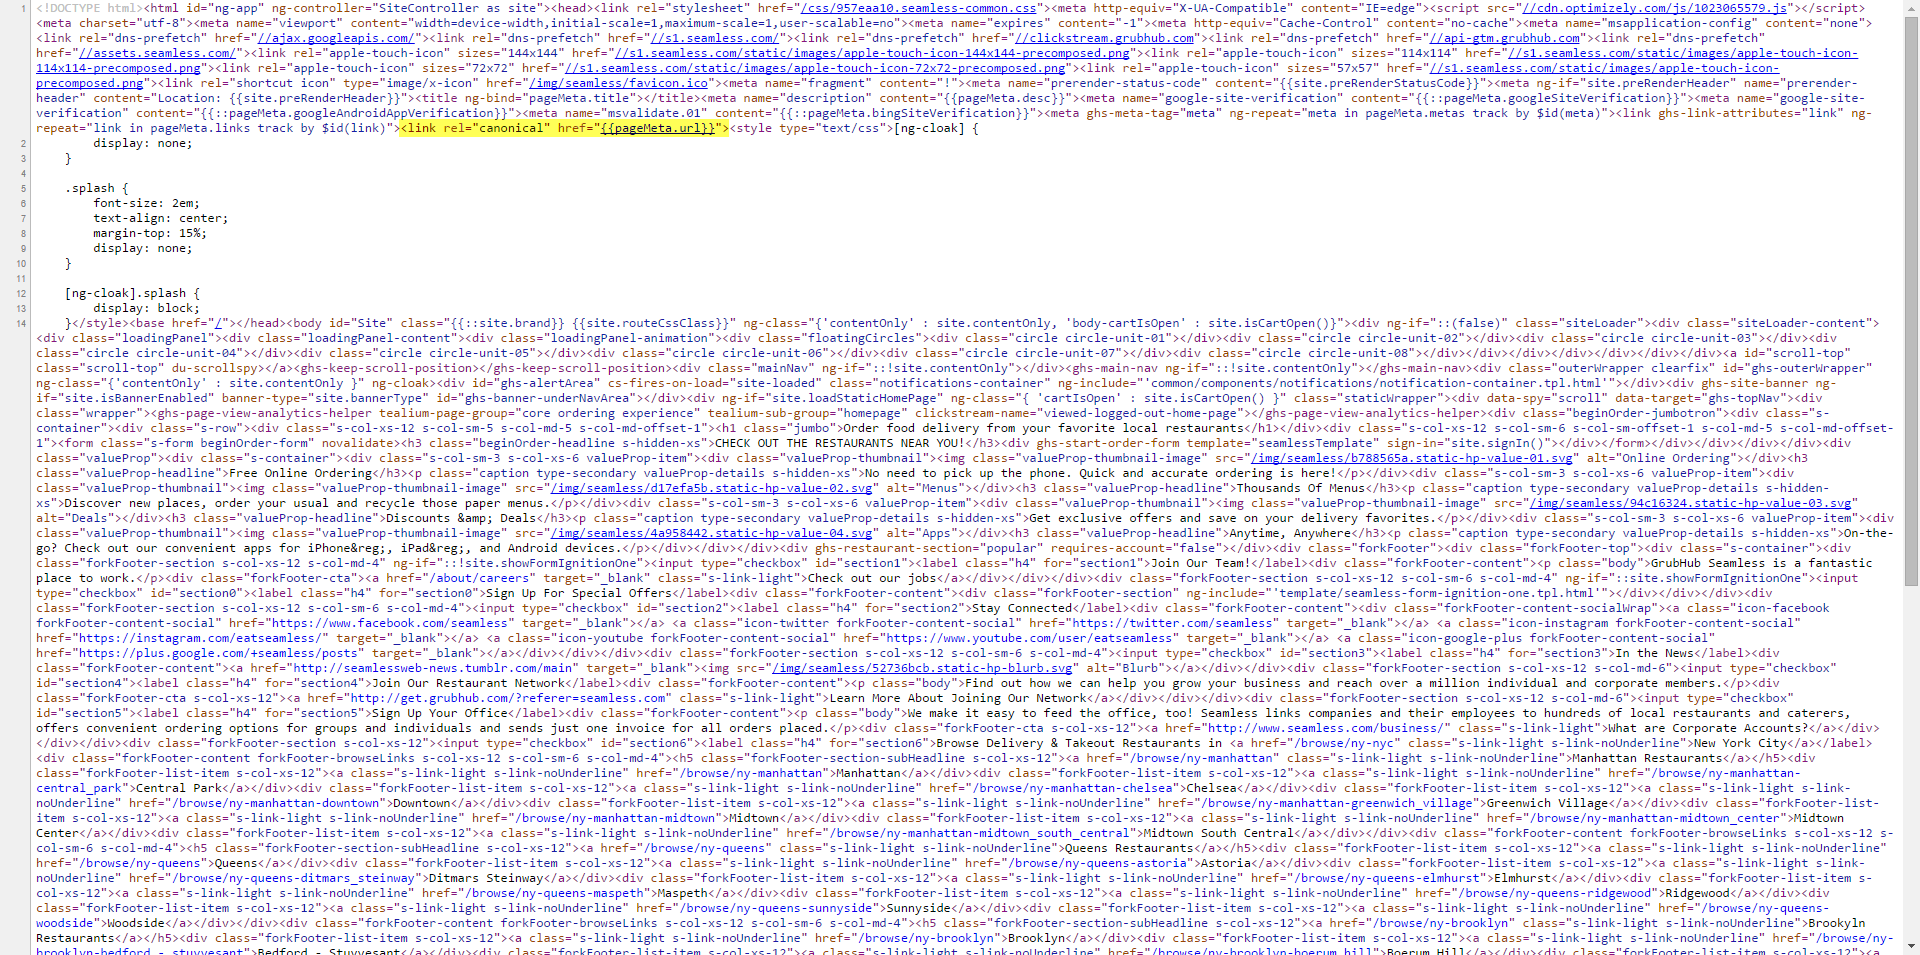
For instance consider the source view of Seamless.com, a site built with AngularJS. The code is minified, which makes it difficult to read and there’s a variety of variables that don’t get filled in until the JavaScript is executed. I’ve specifically highlighted the rel-canonical tag here.
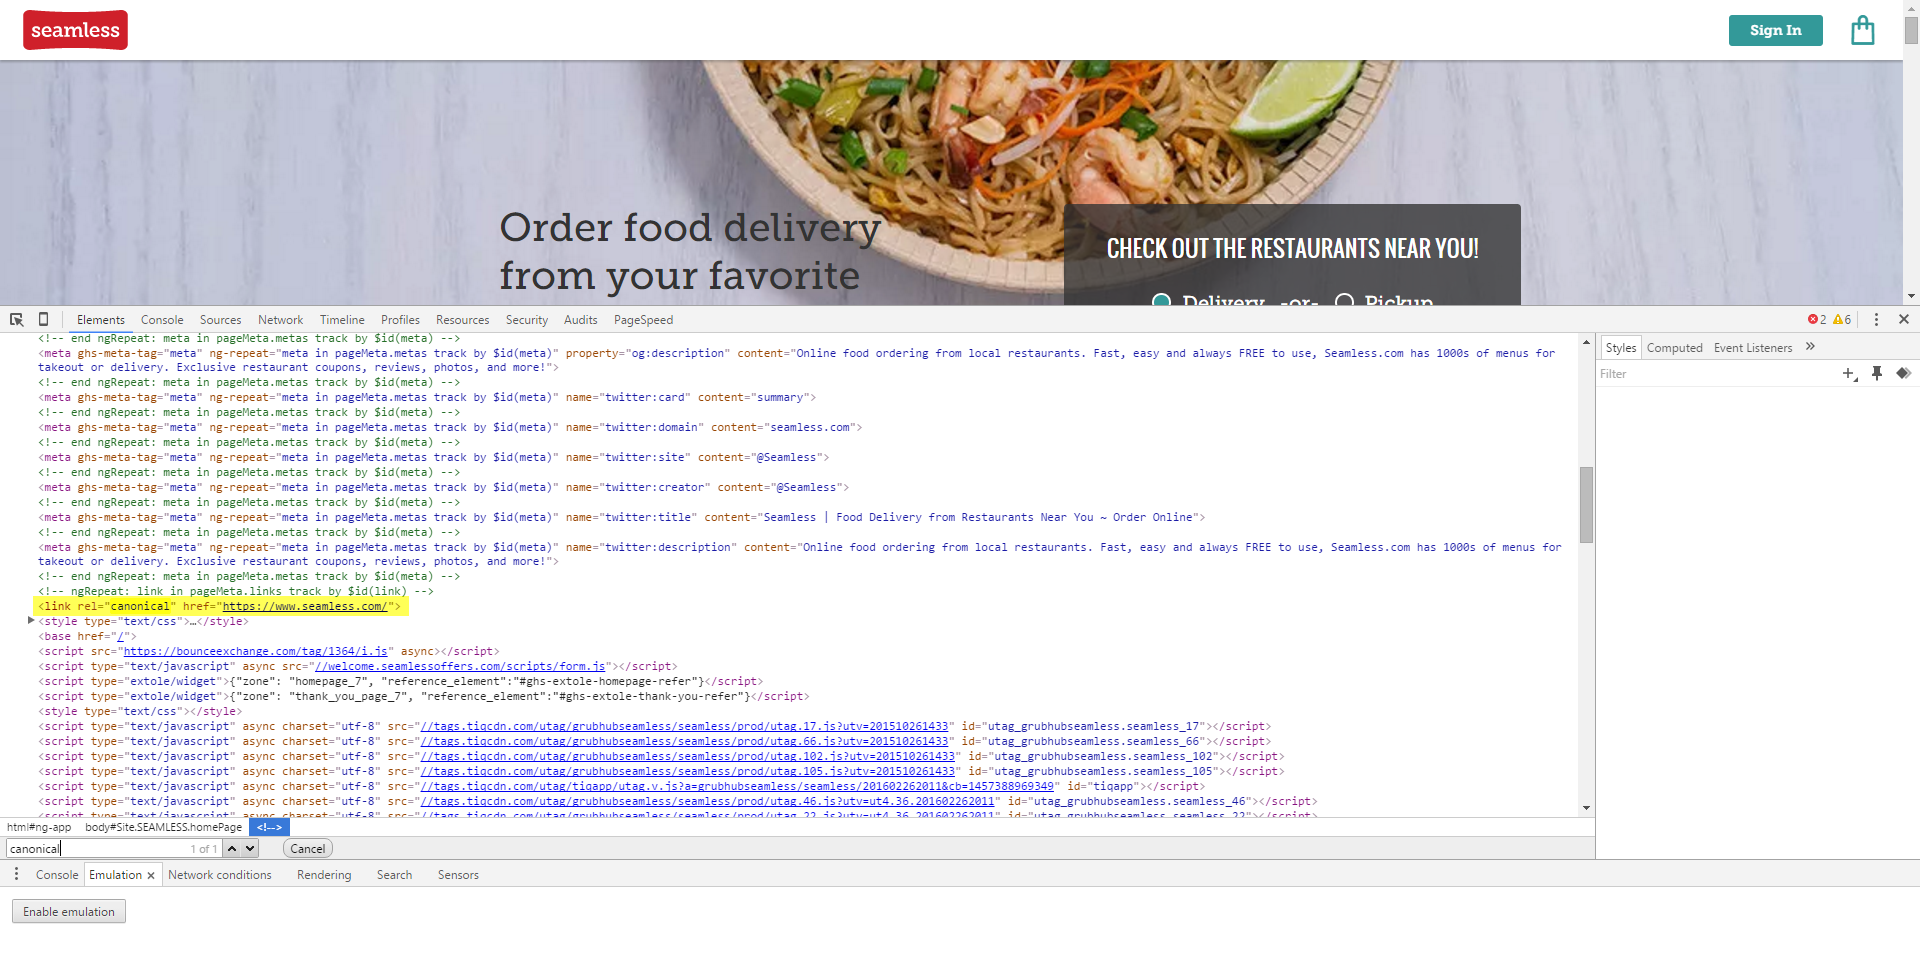
Opening the page in Inspect Element gives you properly constructed an executed DOM that reflects what is rendered on your screen. Notice that you there is no more code and the placeholder (variables) are now filled in.
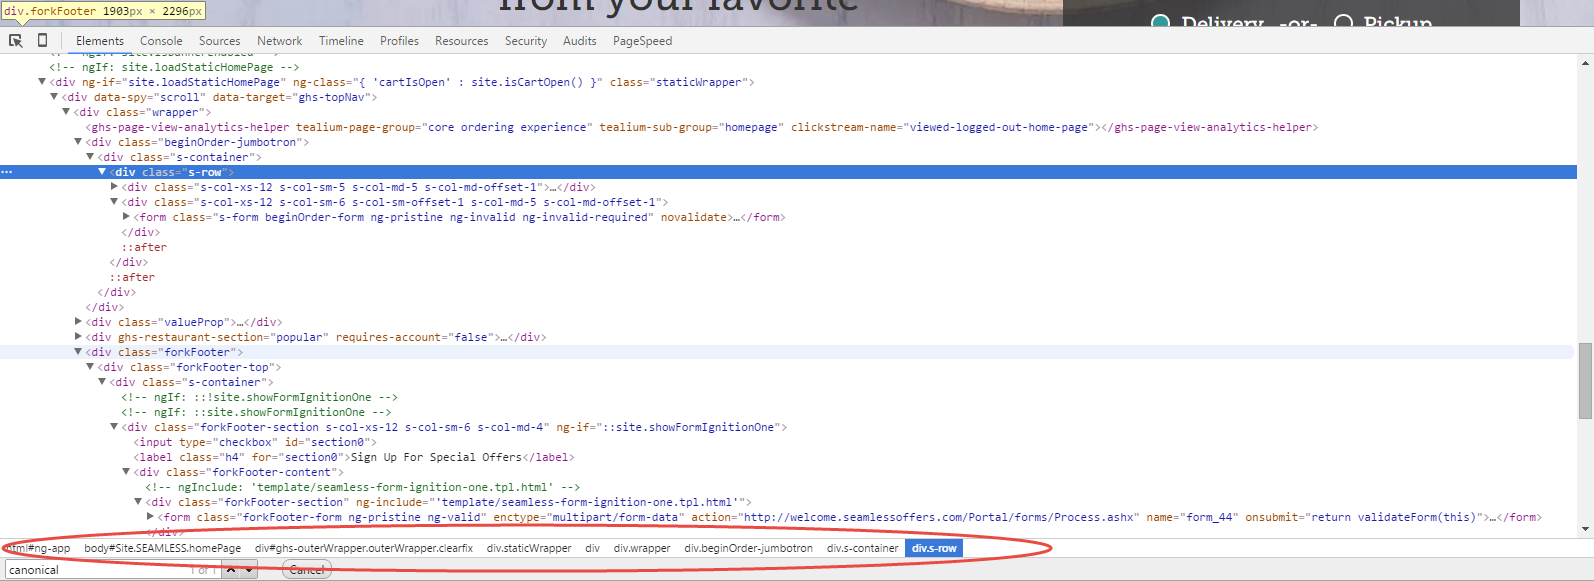
You can also use inspect element to inform much of your scraping, as I talked about in this post. When you inspect and element it will tell you the CSS selectors relevant to it.
View All Headers
Chrome is no stranger to HTTP headers. In fact, you can see them all, not just the status code, by clicking on the file in the Network tab. In this example page I’ve created you can see the x-robots and hreflang tags being set in the headers.
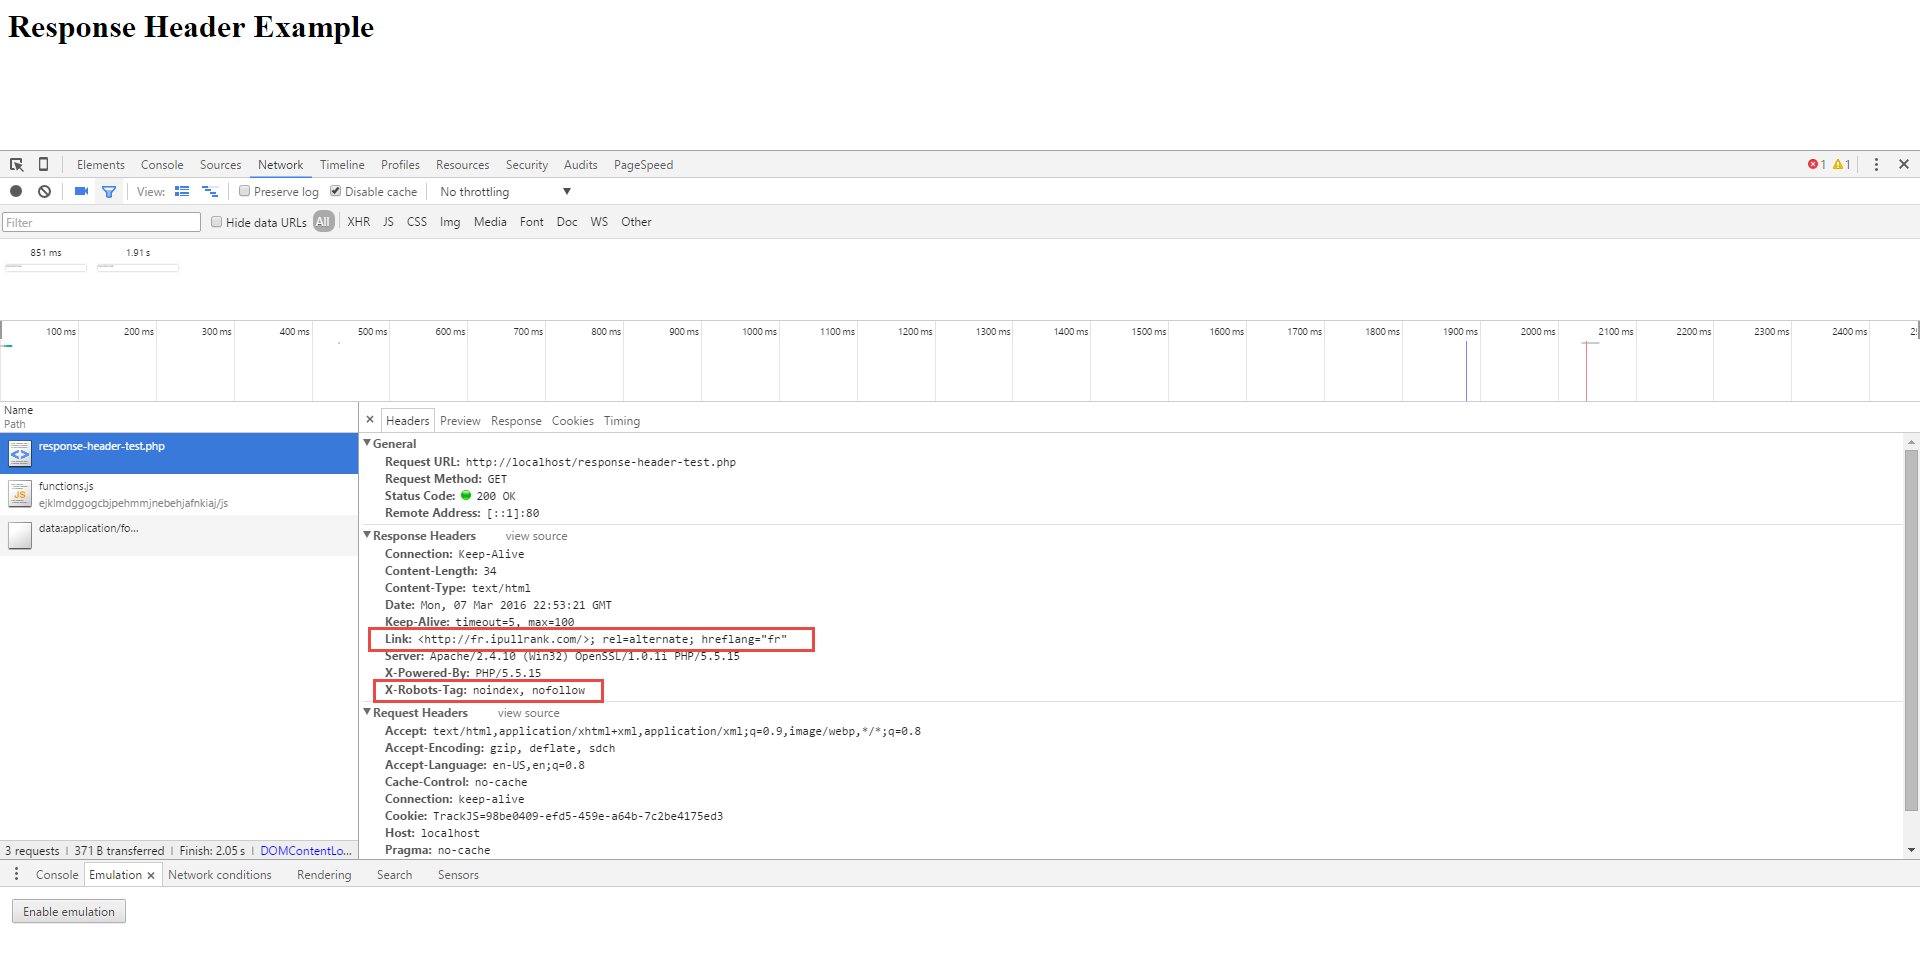
I encourage you to give these a once over as you’re doing your SEO audits, especially when you’re not sure why something isn’t getting indexed.
Remote Debugging
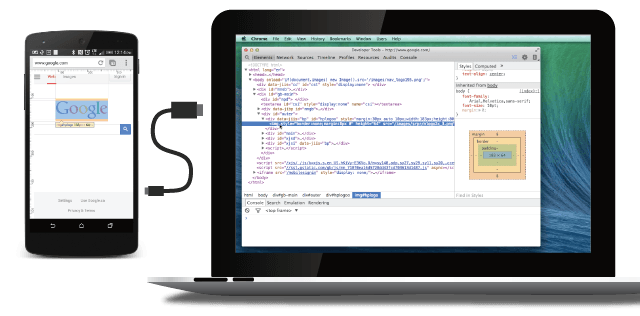
While DevTools give you the ability to emulate different user agents, nothing beats the real thing, especially when you want to get a true sense of the time it takes to load your webpage on a mobile device. This is where the concept of Remote Debugging comes into play. Remote Debugging allows you the ability to plug your phone into your PC and manipulate it from your browser. You’ll be able to see everything that you see in DevTools in the desktop context, but specifically for what is happening on your actual mobile device. In other words, you can use your mouse to control the scrolling on your phone.
This can also be done in Firefox Developer Edition and for iOS with Safari, but since we’re mostly talking about Chrome here, let’s also limit it to Android. Note: While iOS does allow this with Safari 6 and up, Safari is only available for PC up until 5.1.7. If you’re going to want to remote debug iOS, just walk across the room to one of the 20 Mac Users in your general vicinity. Alternatively, you can look into remote debugging tools like weinre which predate the in-browser remote debugging capabilities. For more on weinre and Valence check out this post.
To enable Remote Debugging on your Android phone, first you’re going to need a USB cable. Not sure if other Androids come with a USB cable by default, but the Nexus 5 did not. The rest of the steps are as follows:
- Go to settings in Android
- Hit the “Build Number” section 7 times. It’ll say something like “you are 3 taps away” to let you know you’re doing the right thing.
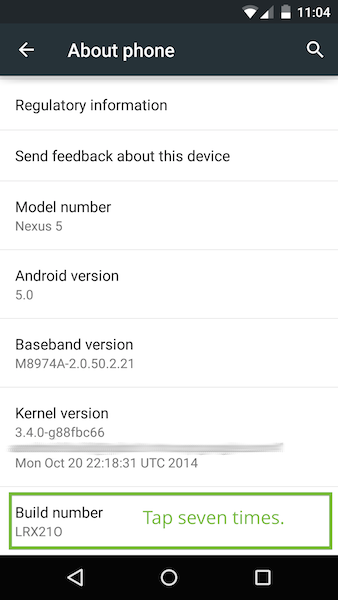
- Then it will give you Developer Options. Enable USB debugging.
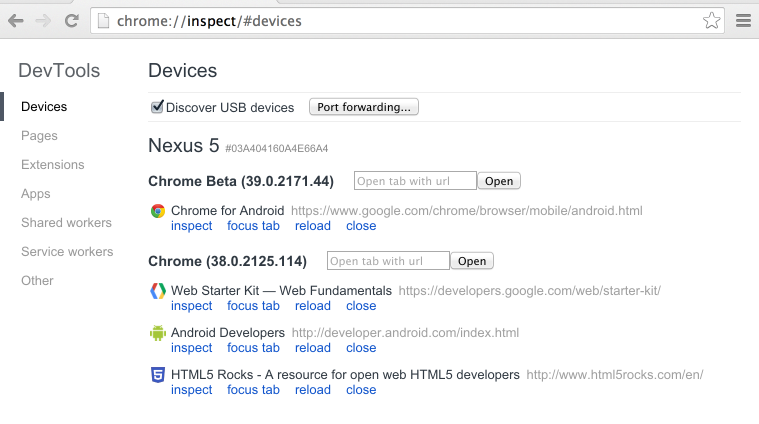
- Plug in your device and go to chrome://inspect
- Your device will then ask you to allow USB debugging. Touch OK.
- From chrome://inspect you can now access your devices.
From there, you can perform analysis as you normally would in DevTools or whatever plugins you prefer. Granted, Chrome does have throttling and user agent switching, but sometimes you want to see how things act in the wild.
User Agent Switching
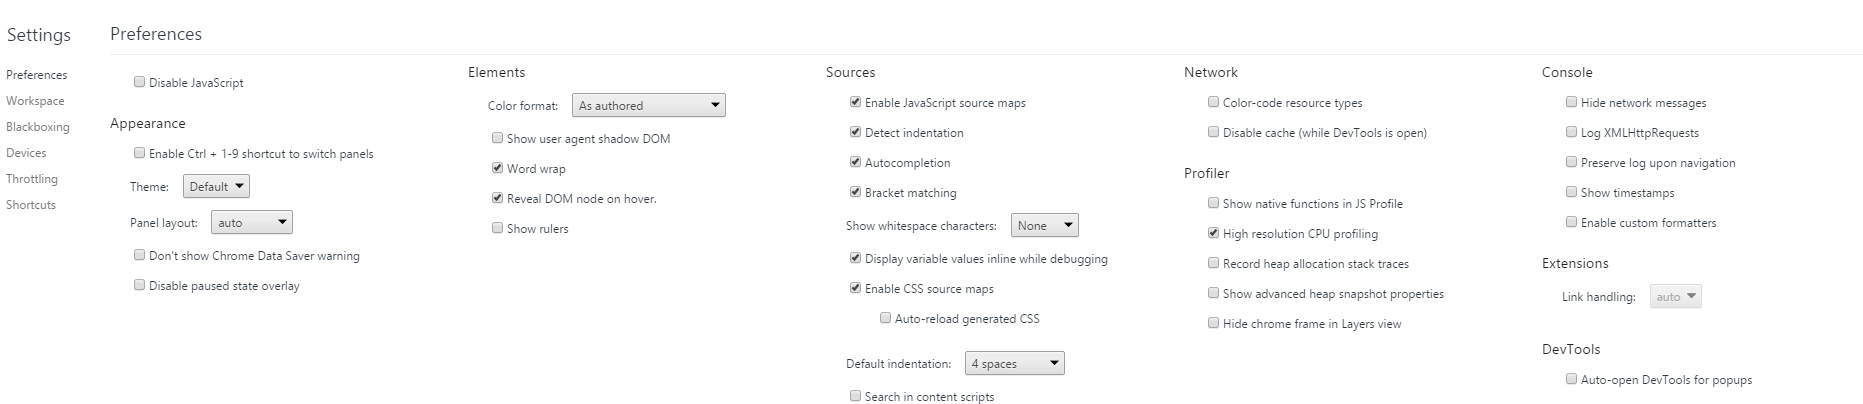
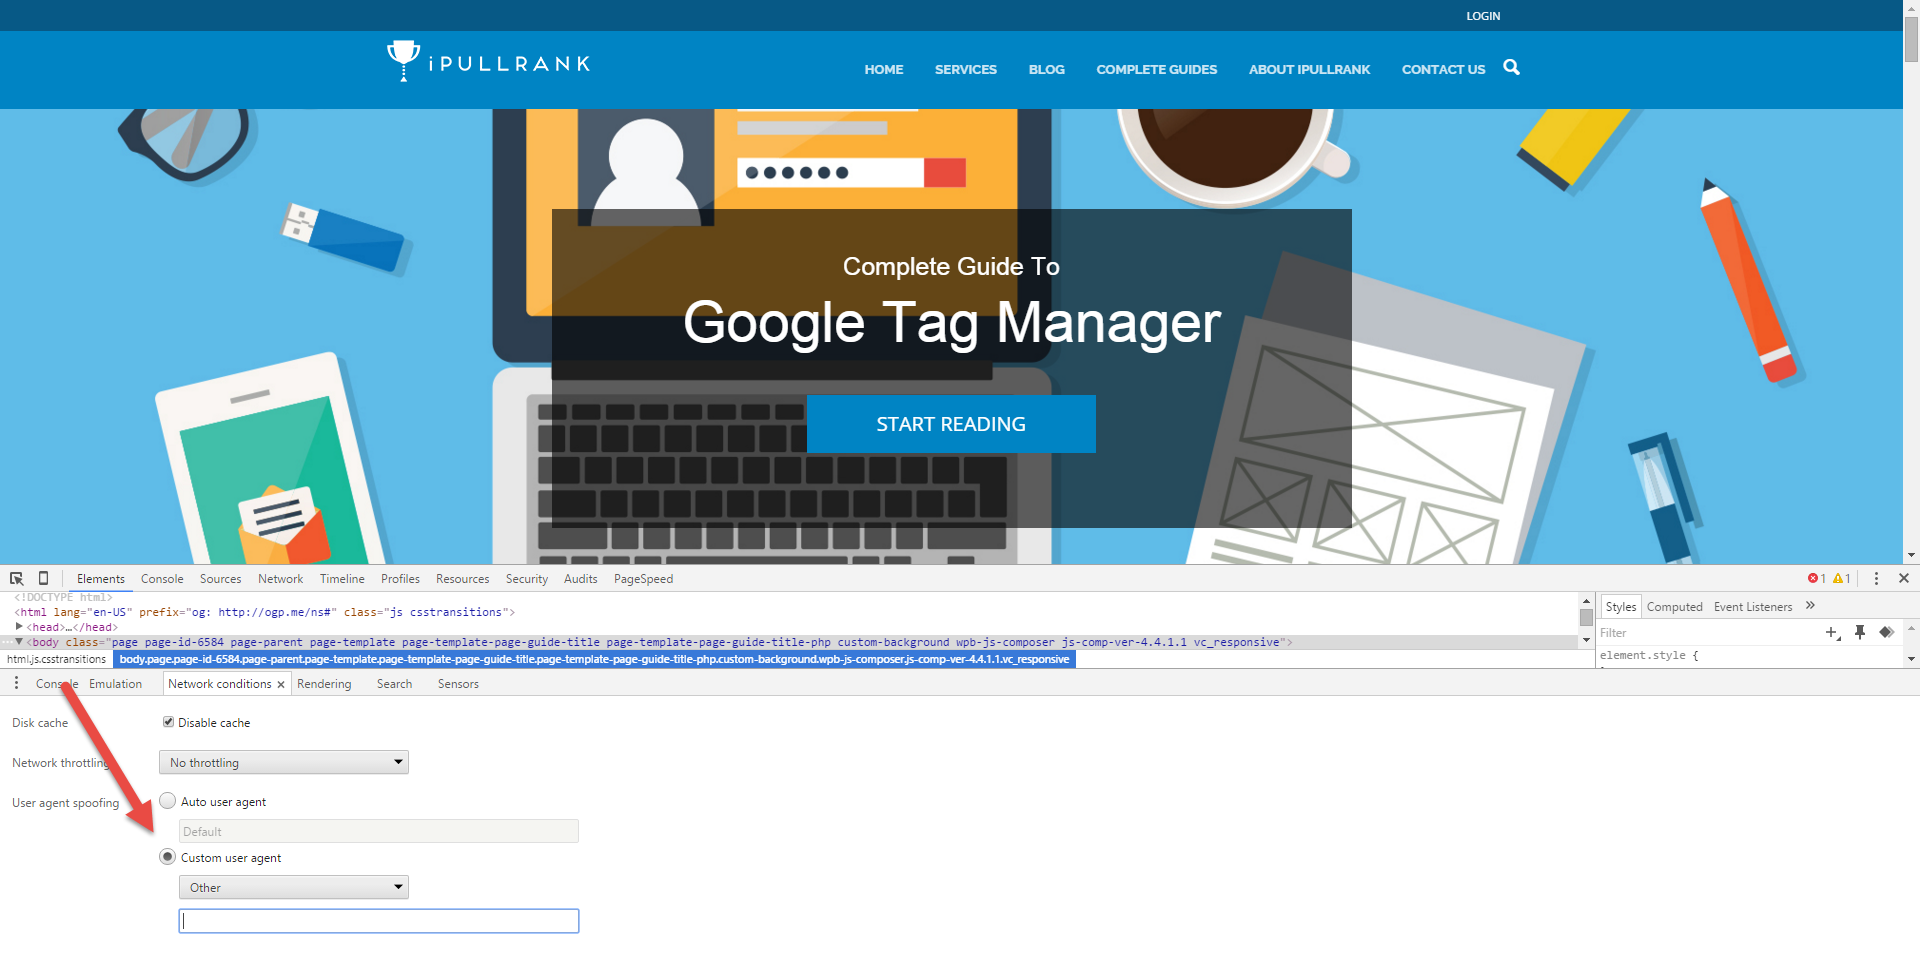
Everyone has their favorite user agent switcher, but frankly you don’t need it. DevTools has all of the main user agents and you enter a custom user agent at any time in the Network Conditions section.
Page Speed Analysis using the Network and Timeline
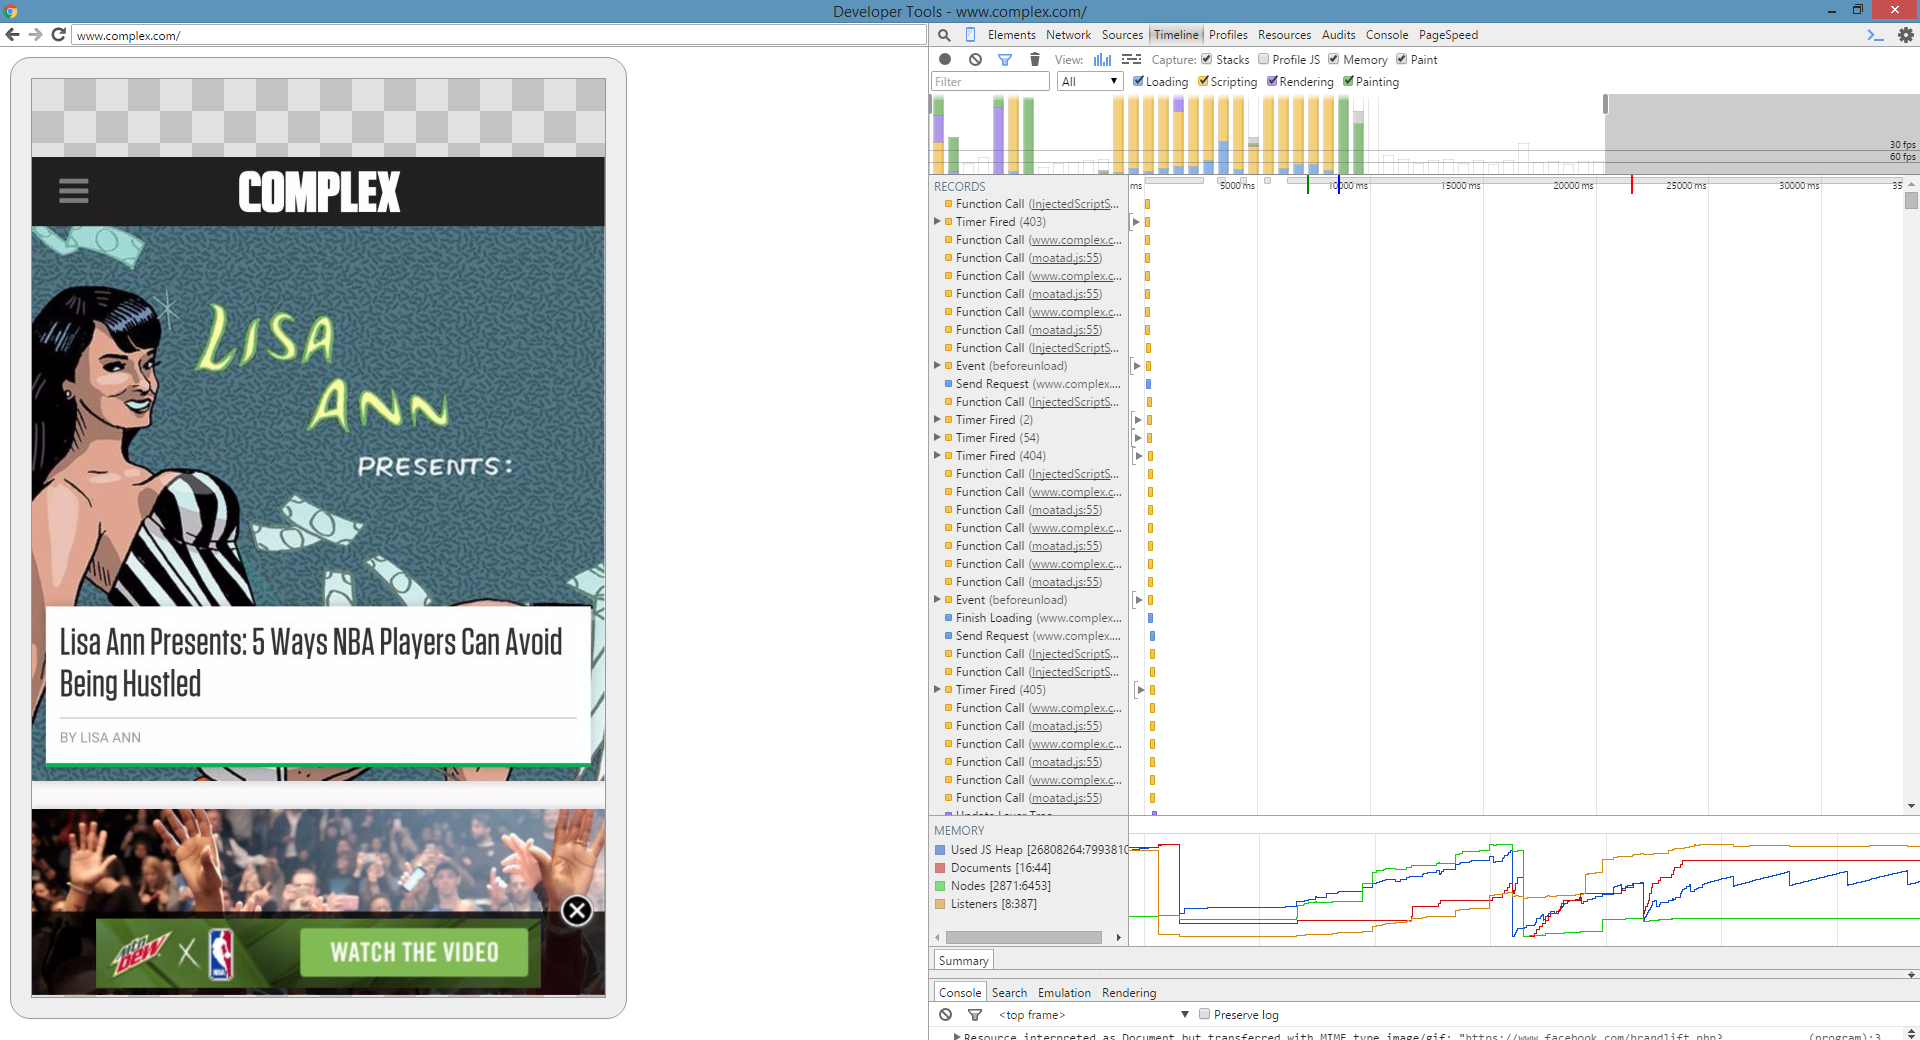
Sure, many of us have PageSpeed Insights which gives a lot of information on how to optimize the Critical Rendering Path in our code, but most of us find the recommendations vague and confusing. I’d suggest checking out Google’s documentation on PageSpeed Insights to truly get an understanding of what everything means. I’d also recommend checking out this short free course on Udacity about the Critical Rendering Path. What you’ll learn from these resources is that one of the most powerful ways to understand your page speed issues is built into Chrome in the Timeline.
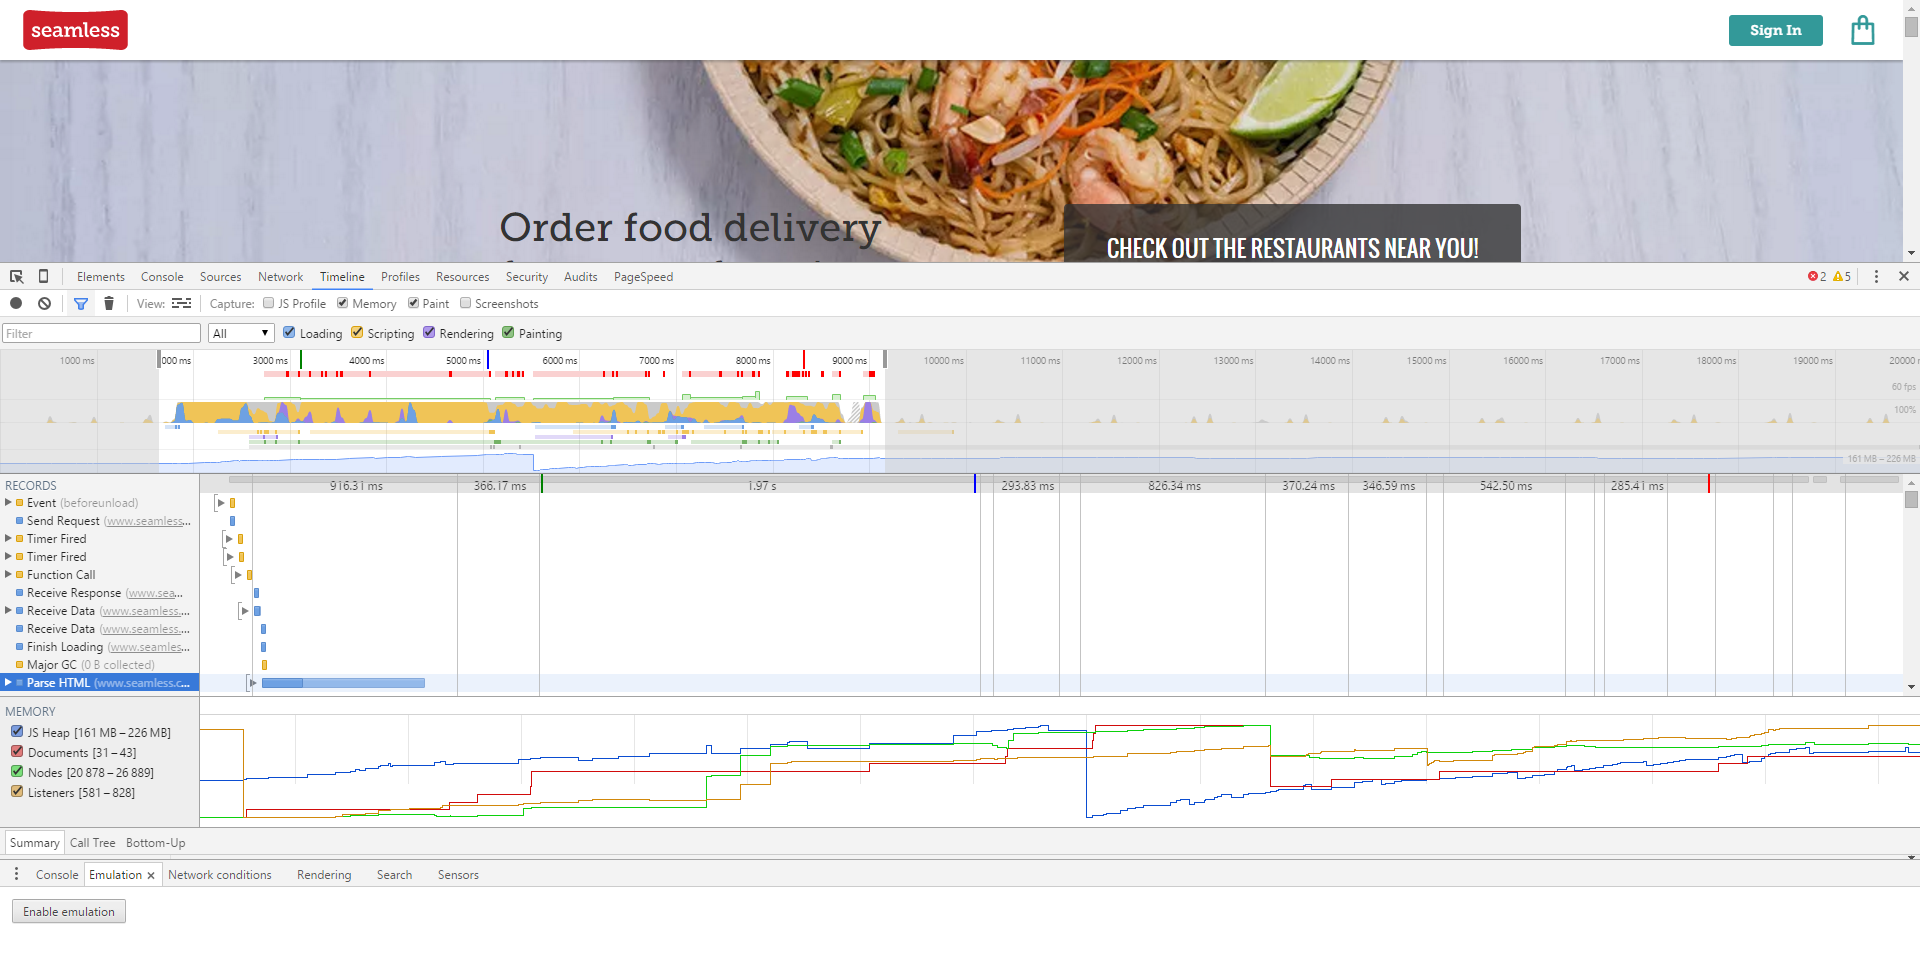
The Timeline breaks down page load time by each operation of constructing the Document Object Model (DOM), the Cascading StyleSheets Object Model, script evaluations and page paints. The charts that it creates give you the opportunity to determine which components of the page are causing the biggest slowdowns. You can look at the loading, scripting, rendering and painting times separately to see which operations are holding up the load. As you can see in the page above, it’s mostly the execution of JavaScript that slows down pages on the modern web. The timeline will allow you to zero on which scripts specifically.
Emulate GeoLocation
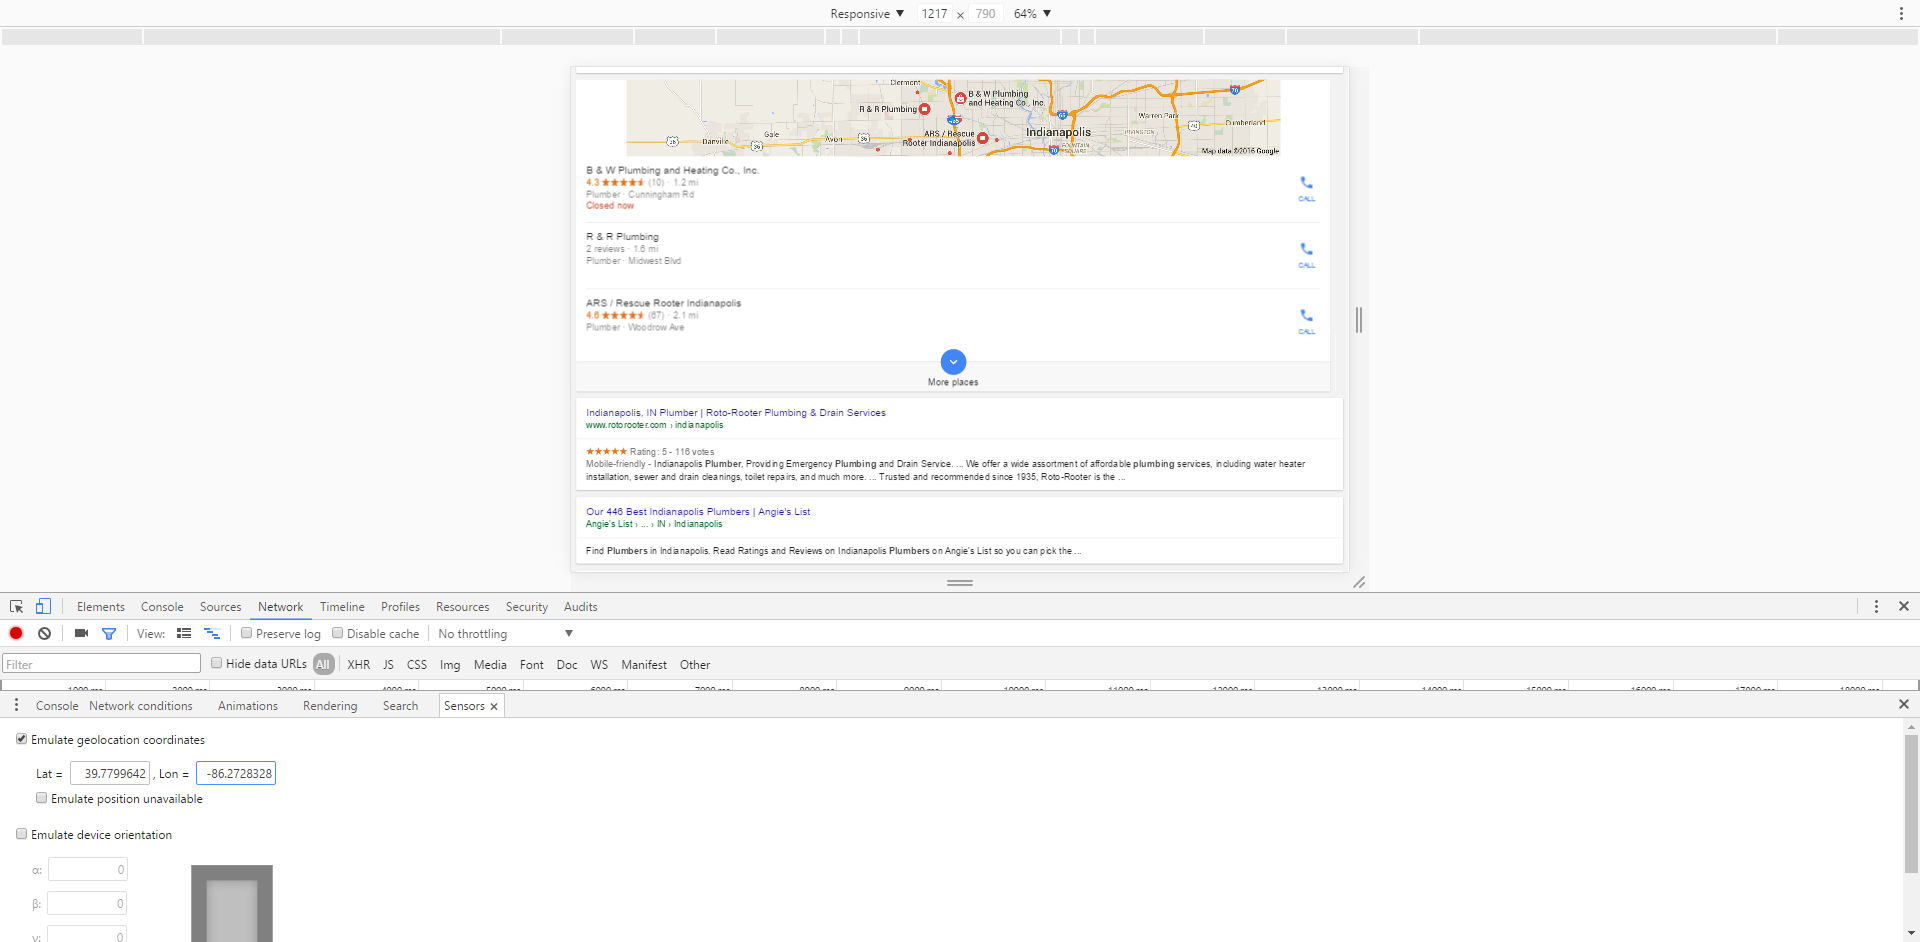
Mobile presents an enormous series of location, device, OS, browser permutations and as of now, it’s very difficult for any rankings provider to tell you what rankings are across all of that. Using the Emulate GeoLocation feature along with the user agent feature, you can spot check to see how you’re performing. You’ll need to use the latitude and longitude coordinates for a given location to specify which location you’re emulating. You can pull those out of the URL in Google Maps. Below you’ll see me looking at what ranks for “plumber” in Indianapolis.
That’s It For Now
There are a ton of other things that I do with DevTools, but most of them happen in the Console. Nonetheless, the key takeaway is that Chrome DevTools replaces a lot of the extensions we’re all using with native support for a lot of those things. It’s a good idea to get to know it better in order to offset some of the things that our SEO tools are not doing yet.
Now it’s your turn, what are some of the use cases in DevTools that you find valuable in your SEO workflow?