

You’re in a pinch and you need segmentation
Working in an agency, and a very small one at that, things tend to move at a rapid pace. I oftentimes find that I am under the gun to produce. Clients want tangible recommendations, results, and most importantly, return on investment (as they should). Multiply a single client by 10, staggered a week or so apart, and ‘under the gun’ soon becomes ‘under a bazooka’. What’s more, the client has no data – or worse – they have data but can’t grant me access to it. Wait, what?! No data?! No access to data?! Now, this is a bind. So, what do I do as a strategy and analytics professional who relies on data to inform just about everything I do? How do l tell the customer story?

The Solution: Employ the following techniques to get you out of segmentation jam
Well, the quick and dirty answer is… I find data. First-hand data, second-hand data…whatever I can get my hands on. “Necessity is the mother of invention” as the proverb goes and improvisation is likely the father. In these situations, I have to improvise – a guy (who resembles Richard Dean Anderson) stuck in the basement of a warehouse, tied to chair with a bomb counting down inside of a deadbolt chest. It’s like my very survival is at stake, and it is contingent upon my ingenuity and ability to create something out of seemingly nothing. I know, survival is a bit dramatic in terms of describing work (though sometimes it feels that way), but I have to get in MacGyver mode. I need to find that paper clip, AA battery, and stick of gum to fashion a solution to my segmentation needs. After all, MacGyver can do it strapped to a chair in a warehouse basement as a bomb counts down. I can do it strapped to my desk as clients ‘patiently’ turn the hour glass.
You can use the following tips to help you find data and ‘MacGyver’ user/customer segmentation. Keep in mind, I am not suggesting this as a replacement for obtaining first-hand quantitative and qualitative data. In a perfect world, nothing beats generating a regression model, running a classification algorithm (i.e. decision trees), and an in-depth survey analysis. But MacGyver and I do not live in a perfect world. This is how we get out of a jam.
Assess the Situation
First off, I need to properly assess the situation. One of the first things that MacGyver did when faced with pending destruction was canvas his surroundings to determine the facts (of his situation). Key questions for him would be: what part of town am I in? What kind of building is this? Am I in the basement? What type of chair am I tied to? Am I bound by tape or rope? Is that a bomb? How much time do I have left? And so on.
I take the same approach before beginning my segmentation efforts. Here, I need to fully understand my project requirements.
These are key questions that help me refine my approach as many of these analyses can yield different results (i.e. segments and personas).
Take Stock
Like MacGyver, I empty my pockets and look around to see what I can use to craft a solution – the foundation for my segmentation process. This step begins my search for data, and one of the best tools I can use here is conversation.
First, I go to my clients’ customer spreadsheets to find customers to interview. I can either conduct the interview via telephone or invite them to the office. I need only to speak to 5-8 customers, which I can get done in a day or two. I ask them plenty of questions about their customer journey and more specifically how they arrived at a solution to their pain point. I also make sure to record any pertinent demographic details (e.g. location, age, gender, income etc.) if you don’t already have them.
If I am unable to speak to customers directly, I find the sales team. Sales are a useful resource for customer data and feedback, even if anecdotal. They are in constant contact with users and customers and such serve as a reliable resource for (indirect) customer knowledge. Additionally, they often develop ‘one sheets’ around target prospects, which may include details I can use in the next phase of my analysis.
To note, if I am not in a time crunch per se, I will conduct an affinity session with key stakeholders. Affinity sessions are a great tool to get stakeholders in one room to share customer information as part of a focused cross-functional brainstorm. This approach can be effective in small and large companies, alike, and can serve as a forum to breakdown silo mindsets. Other functions I target for conversation include UX and marketing teams.
When having a conversation is not possible, I do some desk research. Depending on the industry, it may be as simple as going to industry association websites, or the 10-k (annual report) of a chief competitor. Also, if I have the budget, I purchase a research report from any of the reputable market research firms, which can be a real time saver.
Segmentation Solutions
Now that I’ve taken stock of what I have, it’s time for MacGyver and I to blow up this joint. I’ve got my stick of gum, AA battery, and eye glasses to fashion a tool to help me blast my way out of the building basement just as the bomb goes off (insert cliché jump away from background explosion).
At this point, I now have at least an inkling of how my target audience is or might be. Further, my conversations and desk research in step two gave me a handful of data points (e.g. location, age range, gender, income level) to map to filter parameters in several research tools.
Experian Mosaic, Nielsen Prizm, and Facebook Audience Insights are my main sources to find data. And don’t worry if you have a small budget, Experian Mosaic and Nielsen Prizm each have a limited, less robust version of their platform online for free. With these versions, you can peruse all of the segments and corresponding underlying data in addition to running limited searches with whatever data you do gleaned from your earlier research, to pinpoint relevant segments. This is where the magic occurs. This is taking the gum wrapper and battery to produce a fire that’ll burn through the ropes – don’t try this at home kids.
The sections below are an explanation of this process much like when MacGyver narratively explains what he’s concocting and how it works. So please read further not with my voice in mind, but Richard Dean Anderson’s narration.
Experian Mosaic
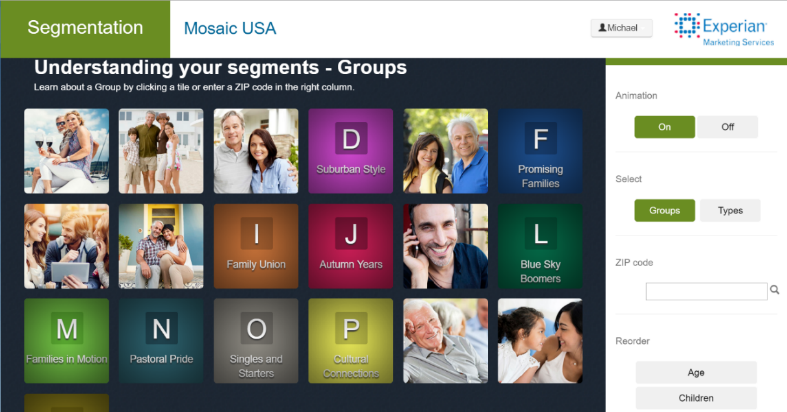
Experian Marketing Services’ Segmentation classifies the US population into 19 groups and 71 unique profiles. Each profile contains data points relating to demographics like age, gender, and household income, as well as psychographics, buying habits, and life events. To obtain access to Experian Marketing Services’ Segmentation Portal go to sign up here. You should receive login credentials in a day or so.
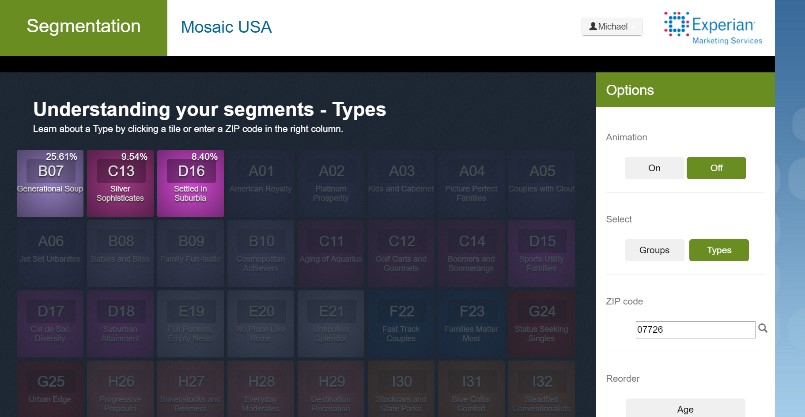
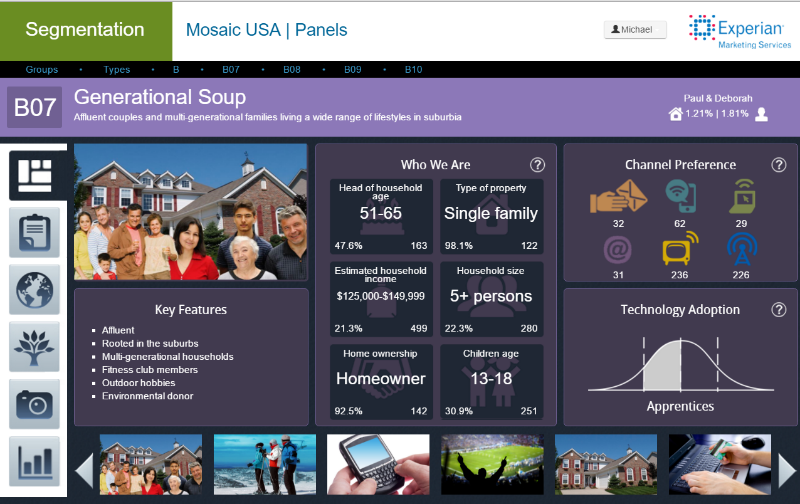
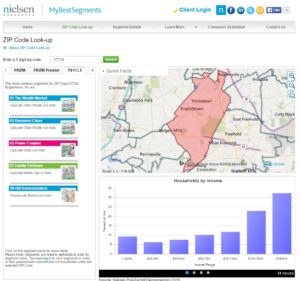
By adjusting the filter levers, I can zero in on groups and profiles that best represent my target audience. For example, say the main zip code of a key customer segment is 07726 (multiple parameters are okay too). After I enter the zip code and perform search, right away I see three profiles that make up the majority of people who live within that area. I can click on each of these to read a summary of key demographics, features, attitudes and preferences. Moreover, I can use the left-hand side navigation to access detailed profile descriptions, geographical mapping, and word clouds.
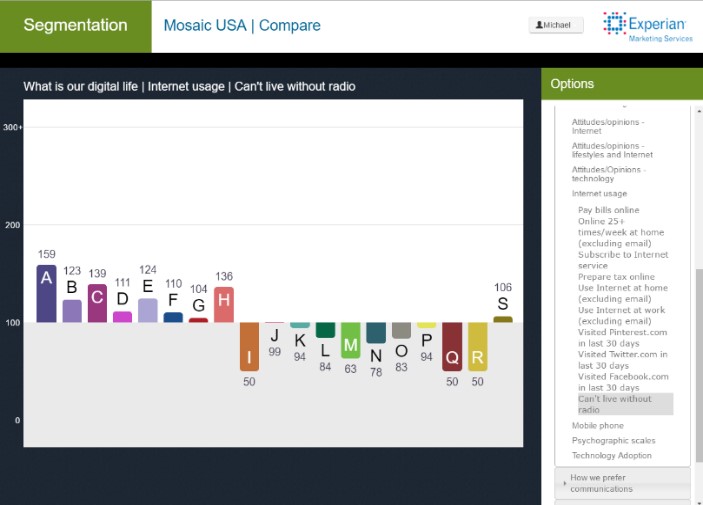
For additional data insights, I can delve deeper into Experian’s feature set to compare index scores across demographics and preferences ranging from family structure to mobile phone use. Certainly, it’s not the efficient, user-friendly interface of the full platform, however it provides adequate functionality to get your segmentation efforts going.
Nielsen Prizm (My Best Segments)
Nielsen Prizm, like Experian Mosaic, segments the US population into groups and segments according to demographic, lifestyle, and media trends. It achieves this through three segmentation systems: PRIZM, P$YCLE, and ConneXions.
Each system has a slightly different focus:
- PRIZM – includes insights related to consumer shopping behaviors and patterns
- P$YCLE – focuses on financial and investment behaviors
- ConneXions – identifies technology purchasing preferences (e.g. video, voice, and data)
As with our earlier example, I can input zip code 07726 into Nielsen MyBestSegments. I receive an output of segments specific to 07726 across Nielsen’s segmentation system. Nielsen also includes a few details on household income, family structure, age, and race and ethnicity.
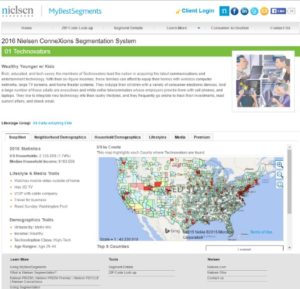
You can click on any of the output segments for a snapshot summary of that segment’s key traits and characteristics. Although Nielsen restricts access to certain demographic and lifestyle details specific to that segment with this platform version, I find the summary descriptions to be quite informative and useful. Nonetheless, the snapshot paints a clear picture of each segment that I find more than adequate for my segmentation efforts.
Facebook Audience Insights
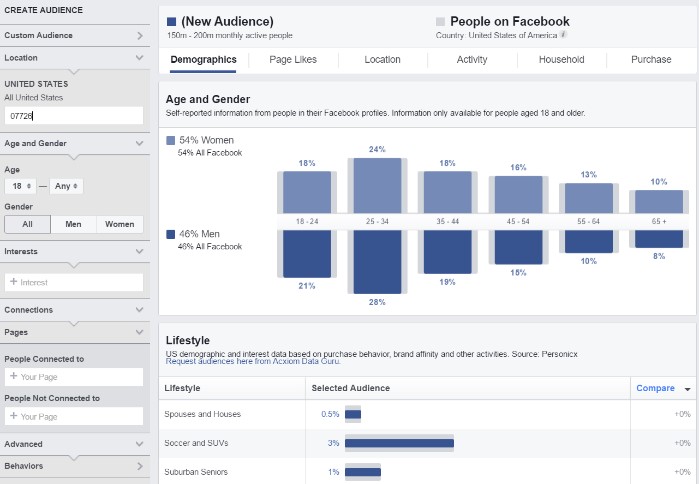
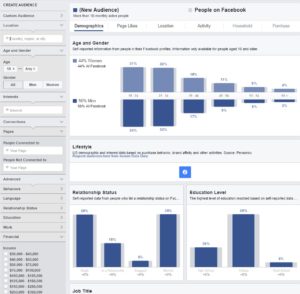
In addition to market research tools like Experian Mosaic and Nielsen, I use as a great tool for target audience segmentation. Facebook has over 1.65 billion active users worldwide, which makes it a pretty good research panel. Through the Audience Insights interface, I can create customized queries based on a number of features from location (i.e. country, state, and city) to household composition. Specifically, I take key features that I identified in step two and input them as filter parameters in Audience Insights. One filter parameter I pay special attention to is ‘interest’. Under interest, I can enter brands, names, occupations and people to further narrow my audience.
Using my earlier example, I can enter the 07726 zip code to single out a location. Then mark additional parameters within income, relationship status, age and gender drilldown to a specific audience in which I can get details on demographics, Facebook activity, brand affinity (based on Facebook activity), household makeup, and purchasing behavior. By clicking on the horizontal tabs across the top, I can access the aforementioned details.
Depending on my segmentation requirements and available data, I can use these tools independently or in concert to produce target audience profiles and segmentation. The process can take anywhere from a couple of days to a week to complete. I usually advise our clients to put into place structured data collection, whether it be CRM, customer services, user testing, surveys etc., so that future segmentation can be performed more efficiently with first-hand data.
So when you find yourself in an emergency ‘break-glass’ scenario around customer segmentation, improvise and get creative with conversation and third-party research tools to ‘MacGyver’ your way to clearer audience insights.

Need expert help with an industry-leading SEO strategy? Contact Us!