
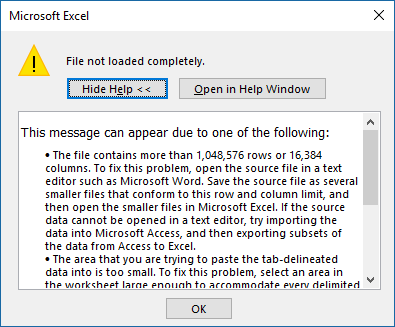
I could start this with a grandiose declaration about big data, but if you’re reading this you already know enough about that. Your issue is more that you’re an Excel wizard, but you don’t know what to do once you have a dataset that is more than 1,048,576 rows and/or 16,384 columns. Even before we get to big data, where we’re dealing with billions of rows, this is an issue that marketers deal with everyday. Whether it’s downloading a dump of millions of tweets, downloading millions of links from your link tool, or reviewing CRM records, if Excel is your only weapon, there isn’t much you can do.
So, today, we’re going to talk about how to do pivot tables in MySQL. This way you can get your data into a place where you can manipulate it and then dump the summarized results into something that can be wrangled and visualized in Excel.
Why Pivot Tables?
The technical term for a pivot table is “cross-tabulation” which essentially means looking at data in terms of other data. Doing so allows us to summarize data and get to insights rather than reviewing data points and records in isolation. Generally speaking, one data point alone does not tell a story or reveal an insight, but cross-tabbing them does. While many of the metrics our marketing tools provide do make an attempt to tell a story out of the box, the marketer, analyst, or consultant often needs to analyze that data to make it actionable.
But you knew that.
For this example, I’m going to take a list of 1.6 million links that I exported and deduplicated from Ahrefs, Majestic, and OpenSiteExplorer and then ran through URLProfiler.
Instructions for Setup
- Download and install MySQL. (Windows / Mac / Linux) – You’ll be using your localhost database for this, but you could set it up on an external host as well.
- Download and install a GUI tool like HeidiSQL (PC) or SequelPro (Mac) or MySQL Workbench (Linux / Windows / Mac)
-
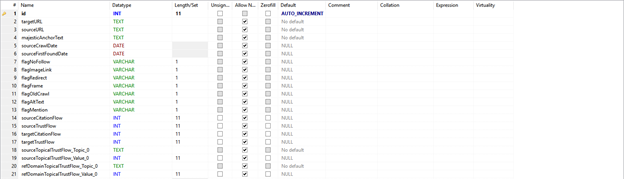
Create a table
- Create a primary key – This is the primary representation of a row in a table. Set it to auto increment so the database automatically gives it a value as new rows are added. I always call this column “id,” but you can call it whatever you want as long as the other data you are importing does not have a column of this name.
-
- Create your columns – Think of each column the same way you name columns in Excel, except you’ll need to specify the datatypes for each variable. For purposes of simplicity, anything that is text up to 65,535 characters, make it TEXT. Beyond that make it BLOB. If it’s a whole number make it INT, if it’s a decimal use a float. If it’s a date, use DATE. Data typing is far more complex in terms of precision and optimization, but for the purposes of this discussion, you’re all set for now.
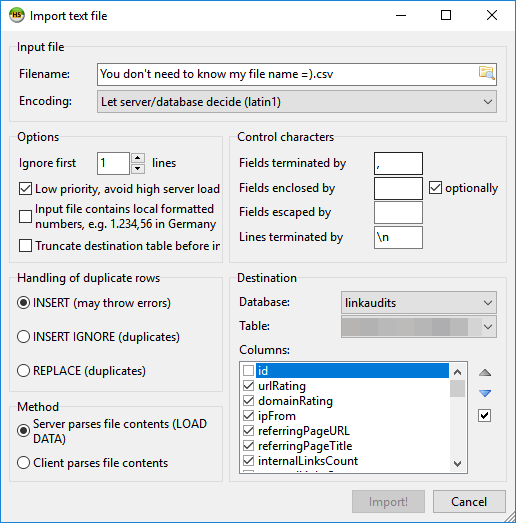
- Import your data – Depending on the GUI tool you’re using, this part should be pretty easy to do. In the case of HeidiSQL, you can use the default settings and just de-select the id columns because the database itself will generate the auto-incremented value.
- Once you’ve imported your data, you can see it by clicking on the data tab.
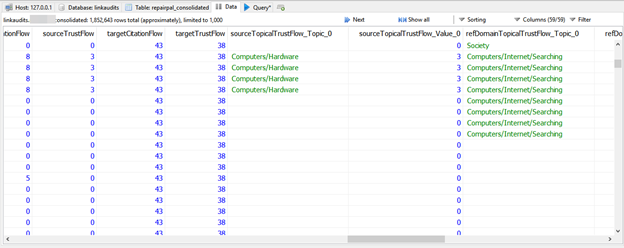
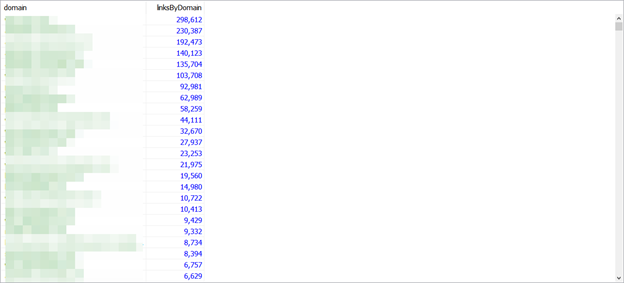
- Run your pivot table queries – In Excel, you have a variety of pivot tables to choose from and we’ll discuss those below. You’ll want to determine the data points to cross-tabulate in order to build your queries. In the screenshot below, I am highlighting the number of links by domain with a COUNT query.
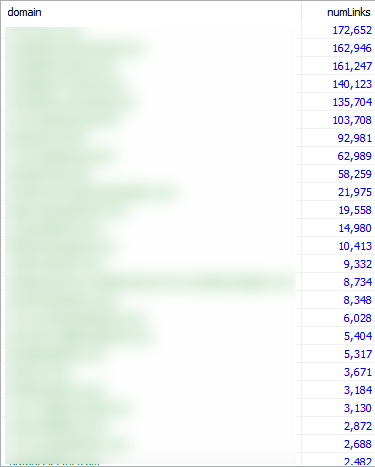
This is the same as running a pivot table and selecting “domain” for rows and “Count of domain” as values.
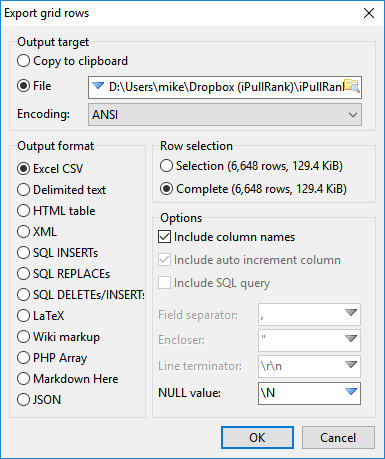
- Export your data to CSV – The summarized data is now a much lighter weight at a much smaller 6,648 rows. Alternatively, you can just copy the data to the clipboard and paste each summary into a different sheet in the workbook.
- Make your charts in Excel – Now that you have your data, you can visualize it the way that you see fit.
Running pivot table queries
You’ll find that functions and functionality in SQL are very similar to those in Excel. Functions wrap variables, statements in parentheses, and they execute on them and give you an output. SQL, however, is all about scale so we can technically do this on unlimited rows, but depending on your implementation of MySQL you may be limited to 1,073,741,824. Yep, that’s a billion. With a B.
The following walks through each query type, matching it up with the functionality of Excel’s pivot table functions.
Sum
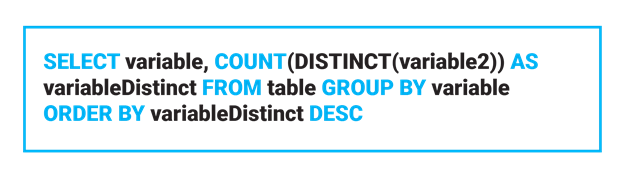
Sum is one of the most often used calculations in both Excel and MySQL. What it does is add up the instances of variables in the parentheses based on the conditions that follow. The diagram below explains the anatomy of the cross-tabulation query and every other query will follow this format.
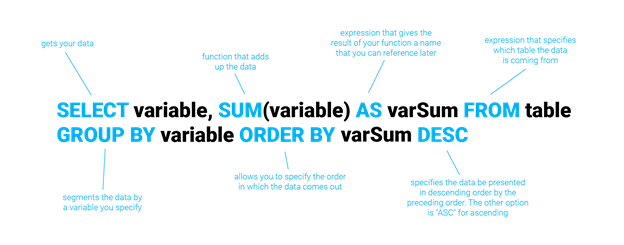
Breaking the query into pieces, here’s what the statements mean:
- SELECT – This pulls the data from the database
- variable – every instance of this indicates the variable (or set of variables separated by commas) being worked on
- SUM – This function adds the variable(s) within the parentheses
- AS – specifies what the column should be called in the output
- FROM – specifies which table the data will be pulled from
- GROUP BY – This part of the statement segments the data, this is the key to generating the pivot table
- ORDER BY – This part of the statement indicates the order the output is presented in; the variable that follows indicates the variable that the ordering is based on and the DESC keyword that follows is an indication that it should be in descending order. You could also output in ascending order by switching it to ASC.
If you’d like to add a filter then you can use the WHERE statement. For instance, if I want to look at the sum of internal links per domain where my filter is domain rating greater than 20 but less than 40, I can combine these by using the BETWEEN and AND operators. In this case, I’d write a query like this:
SELECT domain, SUM(internalLinksCount) as linkCount from linkTable WHERE domainRating BETWEEN 20 and 50 GROUP BY domain ORDER BY linkCount DESC
This structure applies to all of the subsequent queries below and any other MySQL queries you might want to run.
Average
If we want to compute the average of any data point by another data point, we’d use the AVG() function.

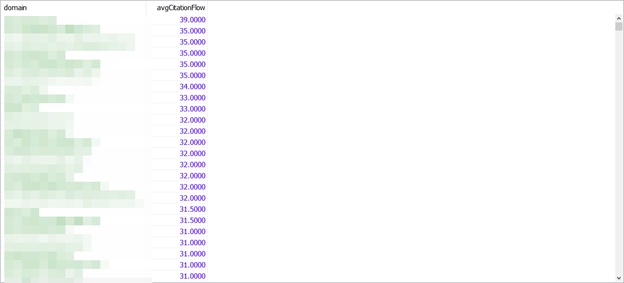
In this case, let’s say I want to compute the average citation flow of the links by domain, I’d write a query like this:
SELECT domain, AVG(sourceCitationFlow) as avgCitationFlow from linkTable GROUP BY domain ORDER BY avgCitationFlow DESC
Count
If we want to count the instances of a data point in terms of another data point we use the COUNT() function. In the case of the pivot table we’re generating, we’ll also want to look at the count in terms of other variables.

If I want to count the number of links per domain, I’d write a query like this:
SELECT domain, COUNT(*) as linksByDomain from linkTable group by domain order by linksByDomain desc
In this case, it doesn’t matter which column you choose for the count function, so I’ve used * as the variable. * indicates all columns in the row, but in the case of COUNT() it will count them as rows.
Once you’ve run your queries, you can export the data as a CSV and then you’re on your way to visualizing the summarized data as you see fit.
Max
If we want to compute the maximum value of the column in terms of other data points, we use the MAX() function.

To pull the best page authority per domain, you’d use a query like the following:
SELECT domain, MAX(pageAuthority) as maxPA from linkTable GROUP BY domain ORDER BY maxPA DESC

Min
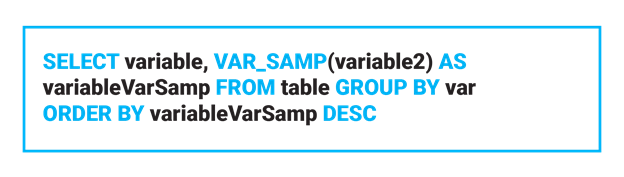
Similarly, if we want to generate a crosstab on the minimum value we use the MIN() function.
SELECT variable, MIN(variable2) as variableMax from table group by variable order by variableMax desc

Perhaps I want to get the worst page authority by domain:
SELECT domain, min(pageAuthority) as minPA from repairpal_consolidated group by domain order by minPA desc

Product
Unfortunately, there is no Product function in MySQL. Those of you looking for product-based pivot tables will need to take a different approach.
Count Numbers
Count numbers in Excel count the number of distinct values in a column. To do so using MySQL you’d wrap the variable in the DISTINCT() function and then into COUNT().
If I want to count the number of discount links per domain, I’d use the following query:
SELECT domain, COUNT(DISTINCT(url)) AS urlCount FROM linkTable GROUP BY domain ORDER BY urlCount DESC
StdDev
Standard Deviation takes a sample of the data and calculates the variation of a given data point against the dataset.

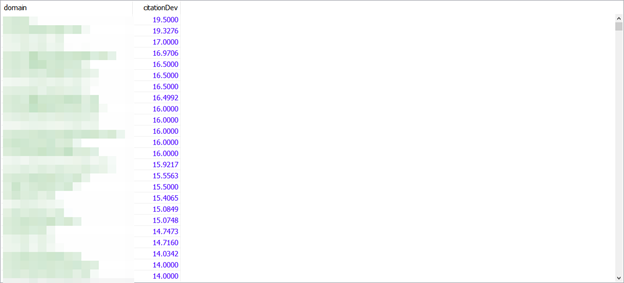
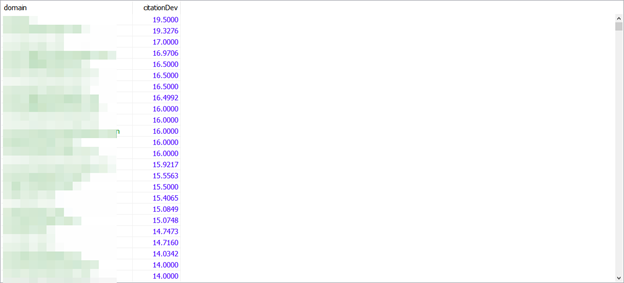
If I want the standard deviation of citation flow by domain, the query would be:
SELECT domain, stddev(sourceCitationFlow) as citationDev from linkTable GROUP BY domain ORDER BY citationDev DESC
StdDevp
Standard Deviation Population is the same as the above, except it uses the entire data population for calculation.
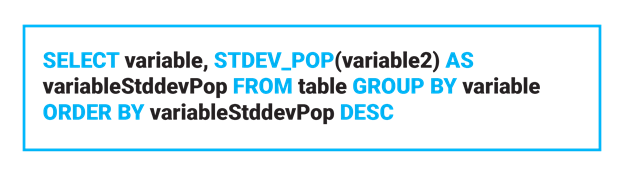
SELECT domain, stddev_pop(sourceCitationFlow) as citationDev from repairpal_consolidated GROUP BY domain ORDER BY citationDev DESC
In this case, the values are the same between stddev and stddev_pop.
Var
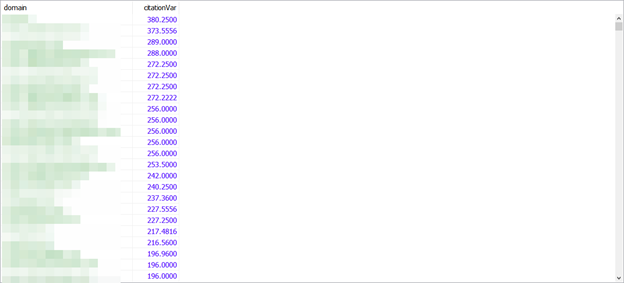
Variance in Excel represents the calculation of variance, which is standard deviation squared. You’re looking to see how the set of column data points varies from the average value.
SELECT domain, var_samp(sourceCitationFlow) as citationDev from linkTable GROUP BY domain ORDER BY citationDev DESC
Varp
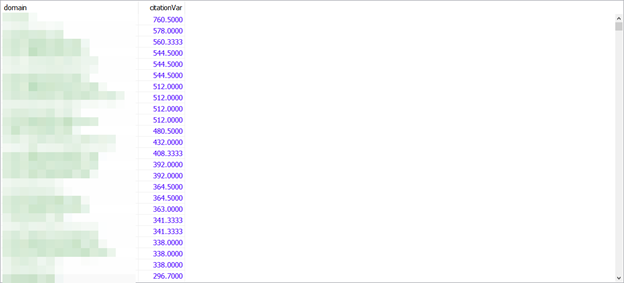
Varp is the same as Var in Excel, but it focuses on the population rather than a random subset.

SELECT domain, var_pop(sourceCitationFlow) as citationVar from linkTable GROUP BY domain ORDER BY citationVar DESC
Excel is dead to me
Like you, I’m honestly not sure why Excel still hasn’t caught up with the needs of the modern marketer. And you may not have the time or inclination to learn R or Python to wrangle your data — and that’s fine, but you’re still going to run into datasets that aren’t necessarily big data and you have to turn them into insights. Hopefully, you’ll find MySQL as good an alternative as I have.
Need EXPERT HELP with an industry-leading SEO and CONTENT STRATEGY? CONTACT US!