Nearly 70% of people believe that government officials, media, business leaders, and journalists deliberately mislead the public, according to a 2025 report by the global communications firm Edelman.
As content markers and content strategists, it’s our job to change that.
In some industries, businesses have even emerged as a leading player in addressing societal issues, with many people viewing companies as more competent and ethical than the government, according to Richard Edelman, CEO of Edelman. This means that as marketers, we have an immense opportunity (and the public’s blessing) to gain the trust of our audience.
Data journalism is one of the best opportunities for brands to do so. Data-led brand storytelling helps demonstrate company-driven values, builds authority online, and has the power to differentiate brands in a world of AI slop (a term used for shoddy or unwanted AI content).
And, with conversational and generative search becoming increasingly popular, original, trustworthy, and authoritative content is more valuable than ever.
With data journalism, you can create content that fosters trust with your audience and performs well in both traditional and AI-driven search environments. You just need to stick to the basics— original data research, narrative storytelling, and newsworthy distribution.
How does data journalism increase your content's visibility?
Data journalism is a journalistic practice of using data, statistics, and visualization to tell compelling and newsworthy stories. This matters because, according to a recent study on optimizing content for generative search engines, using quantitative data can significantly increase content visibility by up to 40% in large language models (LLMs).
Overall, the top-performing methods to gain visibility included citing sources, adding credible quotations, and incorporating statistics into the content. Stylistic improvements, such as fluency and readability, also bolstered a source’s likelihood of getting featured in LLM-generated responses.
Essentially, the study implied that content should convey authority and be easy to read.
Likewise, my energetic colleague, Garrett Sussman, Director of Marketing at iPullRank, has also extensively covered what works for increasing visibility in Google’s AI overviews. Like LLMs, Sussman says that incorporating unique information not readily available elsewhere into your content can give you an edge.
This concept, known as information gain, involves providing unique insights or data, making your content more valuable and likely to be surfaced by generative AI search algorithms. This is because content with information gain is more likely to get picked up and spread across the web, an idea similar to “Digital PR.”
Let’s do a quick pulse check. So far, we have:
- Incorporate relevant statistics
- Quote subject matter experts
- Cite your sources
- Add original information not previously published
This process sounds very similar to data journalism to me.
To give an example, consider Glassdoor, a popular job reviews website, that publishes an annual report called, Glassdoor’s Best Places to Work 2025. This year’s report has 43,800 backlinks and over 30 million monthly visitors. Over the years, these reports have been picked up and shared by the following (and many other) outlets:
- The Wall Street Journal
- The Washington Post
- Bloomberg
- CNBC
- Forbes
- Time
- MSNBC
- Business Insider
- Yahoo Finance
- Axios
While not necessarily an innovative content experience—see “52 Places to Go in 2024” for a more creative example—Glassdoor’s report shows how proprietary data can help your brand stand out from the crowd and have its voice and insights shared across the web. Eventually, these insights find their way not only into traditional search results but also into generative search platforms.
My witty colleague Francine Monahan also has elaborated at great length on engineering relevant content for LLMs:
““When you’re creating content for the web, one of the best things you can do is include unique, proprietary data or insights. LLMs tend to favor content that stands out and offers something original. If your content includes information that can’t be found anywhere else, like internal research, customer trends, or your own analysis, it helps establish your site as a trustworthy source.”
~ Francine Monahan
For a comprehensive explanation of RAG pipelines, read:
The fact is that we now have a laundry list of places and spaces to optimize for: traditional Google Search, AI overviews and AI Mode, Google Discover, LLMs (think ChatGPT, Perplexity, Claude, Bard, DeepSeek, etc.)—and they all have their own set of rules.
We asked John Shehata, CEO and Founder of NewzDash Real-Time News SEO, if editorial content with original insights or proprietary data also performs better in Google Discover—a platform that surfaces content based on user interests.
“Yes,” he said via email, “but it’s not the only factor. Original content, exclusive data, and unique angles definitely help stand out—we’ve seen it working in our NewzDash tracking across top publishers. But Discover’s algorithm goes well beyond content alone.”
Shehata said other major drivers of performance are headlines and images, user interests (of course), and social traction.
“Trust is everything,” Shehata said. “When content is clear, data-backed, and transparent, users respond—and so does Discover. It’s not about keyword-stuffing or pushing product. It’s about showing up as a helpful, credible source.”
What are the 3 main principles of data journalism?

Spotify Wrapped is one of the most iconic versions of a brand engaging its audience through data. Spotify’s editorial team capitalizes on a deep understanding of music trends along with access to insights from users’ listening habits to create personalized, nostalgia-rich playlists that reflect each listener’s year in music.
Their ability to offer this level of personalization is powered by identifying patterns in their users’ streaming data—data that is then shared globally by hundreds of millions of users who engage with Wrapped every year.
John Nicoletti, Executive Director of the Cronkite Agency and Professor of Practice at Arizona State University, says that although news and content marketing objectives may differ, “the ability to communicate information through thought-provoking stories is what allows messaging to resonate.”
In journalism, storytelling is fact-based, he said via email. It’s grounded in truth and shared with impartiality. For public relations, storytelling takes it a step further, creating a narrative from a brand’s point of view to influence action.
Content marketing, Nicoletti said, “allows for even more creativity,” but that, “despite these differences, the thread that unites all of them is the power of a well-told story to inform, influence, and inspire.”
With this in mind, I’d argue that the three principles of data journalism are:
- Tell a story.
- Source or create first-party data to support that story.
- Design your story with digital promotion and PR in mind
Principle #1: Create a Narrative—Don’t Just Present Data, Tell a Story
Compelling content goes beyond presenting raw data. It involves creating a story. In The Elements of Journalism, the authors outline 11 approaches to consider when planning a story:
- Issues or Trends: Explore broader contexts or recurring themes.
- Explanatory: Dig into the “why” and “how” behind events or ideas.
- Profile: Center the story on a compelling person, place, or object.
- Voices: Use direct perspectives to humanize or illuminate issues.
- Descriptive: Recreate vivid scenes to immerse the audience.
- Investigative: Uncover hidden facts, power dynamics, or wrongdoing.
- Narrative: Tell a story with structure: beginning, middle, end.
- Visual: Use photos, graphics, or illustrations as primary storytelling tools.
- Data: Use statistics and data visualizations to tell the story.
- Audio: Leverage sound as a storytelling medium, such as podcasts.
- Platform: Select the most effective medium (Instagram, text, or video) to target your intended audience.
You’ll need to consider the approaches above and choose the one that best fits the essence of the story you want to tell. It may not be data journalism. But, if the essence of the story is told with numbers, then it could be a good fit.
Remember that data visualization and data journalism are still forms of storytelling, and what is left out is as important as what is included.
“When an audience experiences a well-structured story,” Nicoletti said, “it’s more likely to leave a lasting impression and achieve your communication goals.”
To do so, consider using the inverted pyramid. This traditional newspaper writing style places the most critical information—answering the who, what, where, when, and sometimes why and how—at the beginning of a story.
This format is especially beneficial for online reading, where quick scanning is a common practice. It also reflects the reality that most readers don’t read to the bottom of an article. Get to the point and get there quickly.
Principle #2: Be Original—Source or Create First-party Data
Whether in journalism, PR, or content marketing, stories are more persuasive when backed by research, analytics, and insights. Data brings that “richness” of context to validate your claims. For brands, Nicoletti says, leveraging data allows for stories that both connect emotionally and perform strategically.
“In the era of social media and digital engagement, storytelling without data is meaningless,” he said. “From sports to entertainment to technology, big data and its accompanying analytics have supercharged how we are able to craft narratives.”
Where do you get the data?
Start by identifying the data you already have or can access. Then consider ways to acquire additional information, which could include:
- First-party data: Conduct customer surveys and polls, collect feedback, analyze product usage, and perform audience, market, or product research. A platform like Qualtrics makes it straightforward (and is one of the best platforms for PR research).
- Business-specific data: Consider what data your business might have access to. For example, an airline company could use travel data to create “Your Year in the Air,” which tells you how many miles you flew, how many cities you visited, and what your most common travel day was. (I wonder how many miles Mike King flew on Delta this year?)
- External data sources: These can come from a variety of sources, including government data, market or industry reports, census data, consumer reports, Freedom of Information public record requests, or by scraping websites. You can also use Google Dataset Search to find thousands of government databases that have been made available online.
Consider your specific business and industry, and identify the data sources or resources most relevant to your brand and its audience.
How do you analyze the data?
Before diving into numbers, you need to define what you’re trying to understand or reveal. A strong story begins with a focused question. Ensure your dataset is accurate, complete, and consistently formatted, which may include removing duplicates, correcting errors, or filling in missing values.
Utilize fundamental statistical analysis or visualization tools (such as Excel, Google Sheets, or data platforms like Tableau or Flourish) to identify trends, spikes, or unexpected results. These are often where the story lives. Charts, graphs, and infographics help highlight the key insights and make them more accessible in your content experience.
Put your data in context. Compare across time, regions, or demographics. Use historical benchmarks or industry standards to add meaning. For example, in 1990, a 27-inch color TV cost about $500, which is around $1,200 in today’s dollars. Right this moment, you can buy a 50-inch 4K smart TV for under $300. Not only is it cheaper, but it also delivers vastly better quality.
Every data journalism story starts with asking the right questions and letting the data help answer them. And remember that data alone isn’t enough. Tie your findings to real-world effects—how does the data impact people or decisions? Your story doesn’t have to be serious, it just needs to be emotionally relevant.

Here are 10 excellent examples of data-backed stories produced both by leading news organizations and by brands:
- Year In Search 2024 — Google
- The 2024 Uber Eats Cravings Report — Uber Eats
- Do You Eat Like a Republican or a Democrat? — Time and Grubhub
- The Most Expensive Cities for Food Delivery in the U.S. — Self
- The Best Views Around The World — Remitly
- Where Can You Afford To Buy A House? — The Guardian
- Guest spending boosts US economy by a record $90 billion in 2024 — Airbnb
- What Happens When Wall Street Buys Most of the Homes on Your Block? — The New York Times
- See the Neighborhoods Internet Providers Excluded from Fast Internet — The Markup
- The East Coast is Sinking — New York Times
These content experiences feel authentic to each brand and all encourage some level of engagement. A few feature culturally relevant or timely stories with real-world impact, and others are just interesting. They pique our curiosity.
“Just like a newsroom evaluates the timeliness and impact of a story, content teams should consistently assess what’s happening globally and ask: ‘How does this affect our industry, our brand, or our customers?’” Nicoletti said.
Principle #3: Distribute Like a Newsroom—Increase Your Reach and Relevance
According to Nicoletti, a newsroom operates with urgency and a deep understanding of its audience. He says content teams must be willing to adopt this mindset by monitoring trends, anticipating news cycles, and seeking opportunities to localize broader narratives relevant to their brand and audience.
“To distribute content like an experienced public relations practitioner, content teams must first become passionate consumers of news and cultural trends. They need to understand the media landscape, identify potential risks, and seek opportunities for brand alignment with current events,” he said. “Great PR distribution isn’t just about reach. It’s also about impact and engagement.”
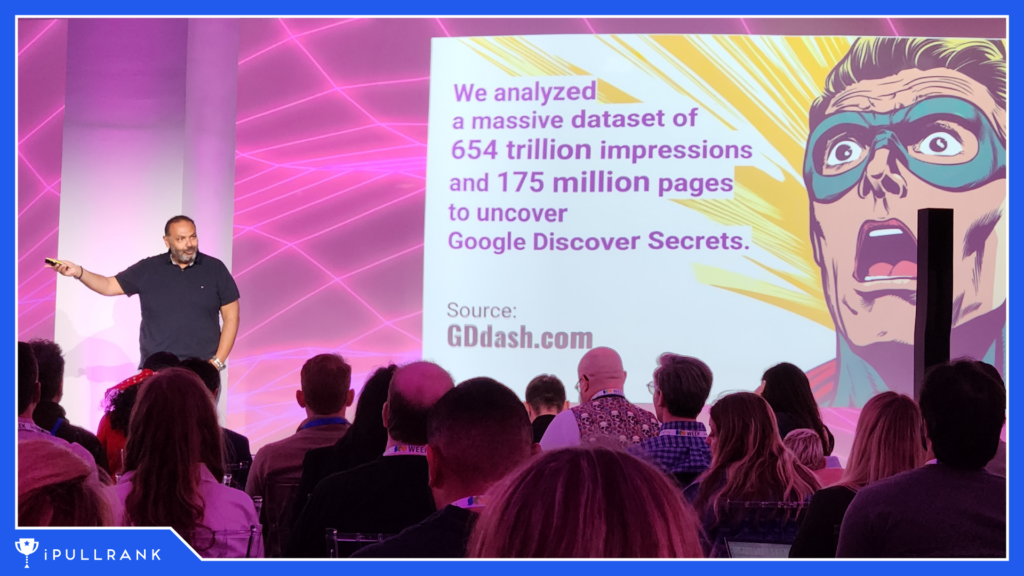
At SEO Week, iPullRank founder and SEO expert Mike King challenged the myth of free traffic. He said organic traffic was never “free” and that SEO has always required investment—that SEO is one of the most powerful yet misunderstood growth drivers for brands.

Its ability to drive brand visibility, qualified traffic, and long-term revenue is overlooked in favor of short-term thinking.
~ Mike King
The same principle applies to data journalism. It takes real resources to create and distribute effectively, but doing so allows brands to unlock SEO’s full potential in meaningful and measurable ways.
Here are a few specific ways to move content beyond the blog:
- Use different lenses to tell the story—create a first-person video narrative, design an infographic, collaborate with a social media influencer, or have your CEO discuss it on an industry podcast.
- Adapt the story across various platforms and media, including text, images, video, and audio, to maximize relevance for each platform.
- Develop press releases, social media content, and email blurbs tailored for distribution.
- Reach out to local and national media, trade publications, and industry influencers to present your story.
- Pitch original research to journalists and digital PR outlets with ready-to-use media kits, including quotes, visuals, and original data spreadsheets.
- Align content with trending topics on social platforms and encourage your audience to engage with it.
- Foster interaction and visibility through community forums.
Distributing your brand’s data-backed content broadly and strategically is not about getting clicks. I repeat, it’s not just about getting clicks. It’s about building trust, visibility, and long-term authority across digital ecosystems, including search engines and LLMs.
The more your story appears across credible platforms (news outlets, social media, podcasts, influencer channels), the more likely search engines and Google’s new AI Mode will associate your brand with expertise and reliability.
For a comprehensive explanation of AI Mode, read:
In turn, being featured in AI-generated overviews and AI mode can boost brand credibility as users begin to trust them for quick, informational answers. Already, nearly 41% of consumers trust Gen AI search results more than paid search results, according to a 2025 Consumer Adoption of AI Report.
Suppose your data or brand is included in those results. In that case, you gain implicit endorsement from Google search or the LLM, similar to being quoted in a top-tier media outlet.
Strategically distributing your content is a form of relevance engineering. It’s the process of engineering your content’s findability, shareability, and contextual value so that both people and algorithms perceive it as relevant across different touchpoints, including search, social, LLMs, and media.
How does the data get told? Six steps for how data journalism happens
At a high level, the data journalism process consists of six key steps. They are:
1. Story Ideation and Planning
Before examining data, you’ll need to engage in some level of editorial brainstorming or story ideation to establish a question or angle to investigate. This is where SEO teams can play a crucial role.
“Beyond even just data journalism,” said SEO Manager at the Athletic, Shelby Blackley via LinkedIn, “the Search team is involved in all iterations of the process.”
Using data, trends, and newsroom judgment, SEOs help identify trending topics and determine what is published.
“We are involved in editors’ and daily meetings, pitch stories regularly, provide recommendations based on what would be best from an audience perspective, and make sure all [tweets] are as optimized as possible.”
Best Practice Tip: Build PR, outreach, and link-building strategies into your branded content from the start.
2. Data Acquisition and Analysis
This step involves gathering, cleaning, verifying, and analyzing data. Fundamental spreadsheet knowledge, such as creating a pivot table, is essential and can be applied in either Excel or Google Sheets.
At the most basic level, you’ll need to know three skills: sorting, filtering, and basic math. The non-profit Investigative Reporters and Editors (IRE) offers data journalism boot camps for those willing to learn in-depth data analysis (I’m not, but you should be).
Best Practice Tips: Clearly explain how the data was collected, analyzed, and interpreted. Remember that a human should oversee any use of AI.
3. Reporting or Writing
This phase is the storytelling phase. You’ll need to collaborate with editors and writers to craft the narrative, write copy, and ensure accuracy. Partnering with SEO and Content Marketing agencies is an effective way to tap into a vast network of freelance writers with portfolios that match your specific needs.
Remember that accuracy is the foundation of your credibility. Carefully verify all the facts, and always talk to the human sources behind the data—data requires context.
Best Practice Tip: Use a consistent style guide and adapt it as needed for your brand. (The Associated Press Stylebook is a good starting point, and the newest edition features expanded sections covering data journalism.)
4. Design and Visualization
To accompany the written word, you’ll need to design static or (even better) interactive visuals that align with the story arc. The Data Visualization Catalogue is a good starting point for exploring visualizations based on function, such as making comparisons or displaying data over time.
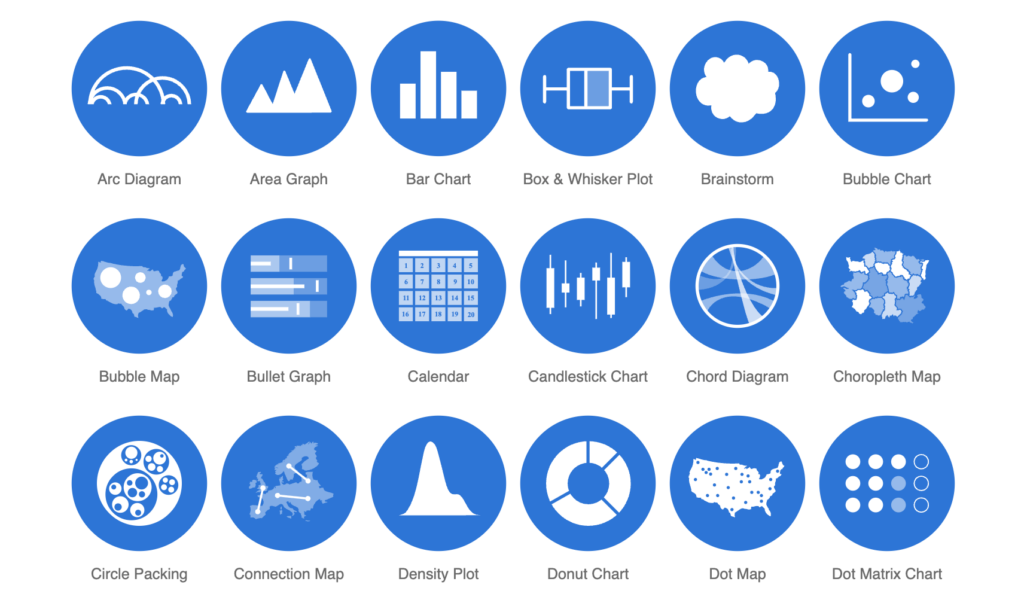
Best Practice Tip: Utilize interactivity and strong visual design to make complex numbers more engaging and visually appealing.
5. Development and Implementation
Next, you’ll need to build the online experience by creating landing pages and ensuring SEO-aligned implementation. The content experience should have a clean and intuitive layout, making navigation easy and seamless. Make it mobile-friendly and fast.
Best Practice Tip: Use accurate, structured data that’s visible on the page and complies with Google’s guidelines, and don’t forget to incorporate web content accessibility elements.
For a comprehensive explanation of optimizing for Google Search, read
6. Publishing and Distribution
Before publishing, don’t forget the final quality assurance and legal review checks. Test the performance of the content experience, and then start promoting!
Best Practice Tip: Rely on SEO and Content teams from ideation to publication, particularly when it comes to ensuring your content is visible in AI-driven search results.
Overall, this process may pull from numerous teams and any number of team members, such as:
- Technical SEO
- Content marketing
- Product
- Data scientists
- Researchers
- Managing editors
- Journalists or writers
- Copyeditors
- Visual designers
- Developers
- Quality assurance teams
- Legal teams
Creating this level of visually appealing, human-centered content that serves your brand, is relevant to your audience, and gains visibility in search engines is no easy feat. Your content team probably can’t churn out 100 of these data journalism articles a month. And that’s precisely the point. They’re unique.
Partnering with an SEO and content marketing agency like iPullRank can help you get started.
Future-proofing tactics that work
Using data to tell a story is an effective way to demonstrate your brand’s value and increase visibility across traditional and generative search engines. Here are some additional tactics to future-proof your story’s success:
- Publish fast—Timely and relevant content with updated URLs signals freshness for search engines.
- Make people click—Write catchy headlines. Use original titles with emotional or curiosity-driven angles.
- Boost engagement signals—Find ways to increase social shares and clicks to show your story is gaining traction with your audience.
- Use high-resolution images—Use real people, not stock photography, and include large previews. Don’t forget about videos, image carousels, and infographics. A diversity of content will help keep users engaged.
- Maintain a value-first approach—Solve a problem, share insights, or educate the reader.
- Analyze performance—Start tracking impressions, not just clicks. Keep track of which stories resonate most with your audience.
John Shehata, says the best approach to visibility on Google Discover and organic search is to ride trending topics and stories for a viral lift and understand what Google surfaces your content for. In this case, content categories and entities matter more than individual keywords.
“The best approach is a hybrid one,” Shehata said.
Hook readers with emotionally compelling titles and strong visuals, and then support it with structured and optimized content for better search performance.
“The bottom line,” Shehata said, “If your [brand] content aligns with user interests and maintains editorial standards, it can absolutely succeed in Discover.”
Make work that you’re proud to share
It’s time to rethink your content strategy in an era of AI-generated content, misinformation, and a decline in public trust. Human-centered, data-driven journalism and storytelling aren’t just a differentiator for brands—they’re a survival strategy.
I firmly believe that journalistic rigor doesn’t have to wilt away alongside local newsrooms, and data journalism isn’t just for billionaire-backed news media publishers. Data journalism is a tool that can and should be used by brands seeking to last for the next hundred years.
Churning out dozens of AI-generated articles isn’t going to cut it from a brand perspective. Your brand is a living entity. It’s every story, every touchstone, every data point. And If you’re not using first-party research and data to support your content, your audience won’t find your brand as a trusted resource when they’re searching for information.
To put it succinctly, if you’re not using data to tell your brand story, you’re already behind.
Our team is leading the movement to professionalize and standardize the field of Relevance Engineering. It’s not just about optimization anymore. It’s about deliberately engineering your content, structure, and data to ensure maximum visibility across every search platform, especially those powered by generative AI.