

I get some version of the same question every week now. A client has two AI visibility platforms running side by side. One says they show up in 41% of the prompts that matter to them. The other says 23%. Somebody on the marketing team has to put a number in a board deck, and they want to know which tool is accurate.
The honest answer is neither. Not because either vendor is lying, but because the question doesn’t have an empirical answer. If you’ve ever had to explain to a client why Search Console shows 10,000 clicks for a month where Google Analytics shows 7,400 organic sessions, you already know the shape of this conversation. Two instruments, two definitions, no referee. There is no true number sitting out there in the world that one of these tools got closer to. In AI Search, “accuracy” is a category error. The only thing you can have is precision, and if you don’t understand the difference, you are going to make expensive decisions based on noise.
I’ve made a career out of samples. In hip-hop, you never get the whole record. You get a loop, a few bars chopped out of something bigger, and the craft is in how consistently you can flip it. It turns out measuring AI search is the same discipline. You’re never going to observe the whole distribution of what these systems say about you. You’re going to take samples, and the entire value of what you’re doing lives in how you take them.
So let’s talk about how the samples get taken. Because the methodological choices underneath every AI visibility dashboard (scraping versus API, logged in versus logged out, one collection versus many) aren’t implementation details. They are the measurement. And most of the people buying these tools have never been told what they’re buying.
We've Been Here Before, Sort Of
When Google rolled personalized search out to everyone in December 2009, a portion of the SEO industry declared rank tracking dead. If every user sees a different SERP, what does “ranking #3” even mean?
We know how that turned out. Rank tracking didn’t die, because the variance was considered small enough to ignore. Personalization nudged things around the edges, data centers disagreed by a position here and there, and local packs made “where is the tracker’s IP” a real question. But for a given query, we collectively agreed most people saw mostly the same ten links most of the time. We built an entire industry on the assumption that a stateless crawler behind a proxy, simulating a user with no history and no context with Google, was a reasonable stand-in for what a human would see. Back in 2020 I argued that rank tracking was conceptually broken for exactly this reason. We were reporting on someone who doesn’t exist, and I proposed tracking with persistent profiles that build context with Google the way real audiences do. Almost nobody did it, because the sterile version was cheap and close enough. For fifteen years, “close enough” held.
That’s the assumption that has quietly died, and a lot of people haven’t noticed yet because the dashboards still look the same.
In my AI Mode post I walked through how Google builds a vectorized representation of the user and how that representation warps the selection of what qualifies as relevant before a single passage is retrieved. Two people asking identical questions can get different citations, not because the question is ambiguous, but because of who they are. That’s not personalization at the margins. That’s a system where the response is a function of the user. And ChatGPT, with memory on and chat history referenced, is heading to the same place from the other direction.
Layer on top of that the fact that these systems are generative. Even with no personalization at all, the same prompt from the same account in the same minute can produce a different answer, because the model samples tokens probabilistically, because the fan-out queries it issues under the hood can differ from run to run, and because the retrieval layer returns whatever the underlying indices happen to hold at that instant.
So what is the “true” answer to “what’s the best CRM for a mid-market SaaS company”? There isn’t one. There is a distribution of answers, shaped by the model, the mode, the retrieval, the moment, and the human. Anything you measure is a sample from that distribution.
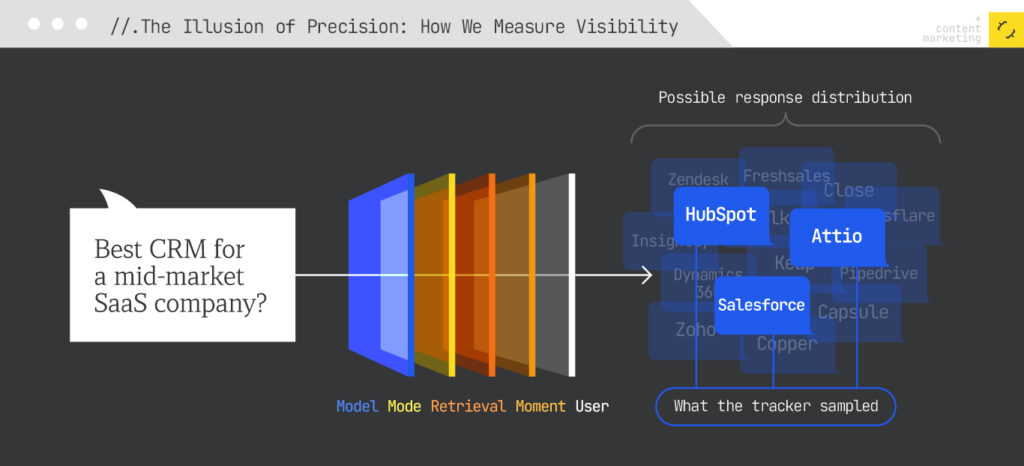
That’s the whole ballgame. Everything else in this post follows from it.
Accuracy vs. Precision: The 10-Second Version
Measurement science distinguishes between two things that marketers use interchangeably.
Accuracy is how close a measurement is to the true value. Precision is how close repeated measurements are to each other. The dartboard version: an accurate-but-imprecise player scatters darts all around the bullseye. A precise-but-inaccurate player lands every dart in a tight cluster in the upper left corner. You can be one without the other.
Here’s the part that matters for us. Accuracy is only defined when a true value exists. When you weigh yourself, there is an actual mass your body has, and your bathroom scale is either close to it or it isn’t. When you measure AI search visibility, there is no actual mass. There is no single response that “the user” sees, because there is no single user and no single response. Asking whether a tool is accurate is asking how close it got to a number that does not exist.
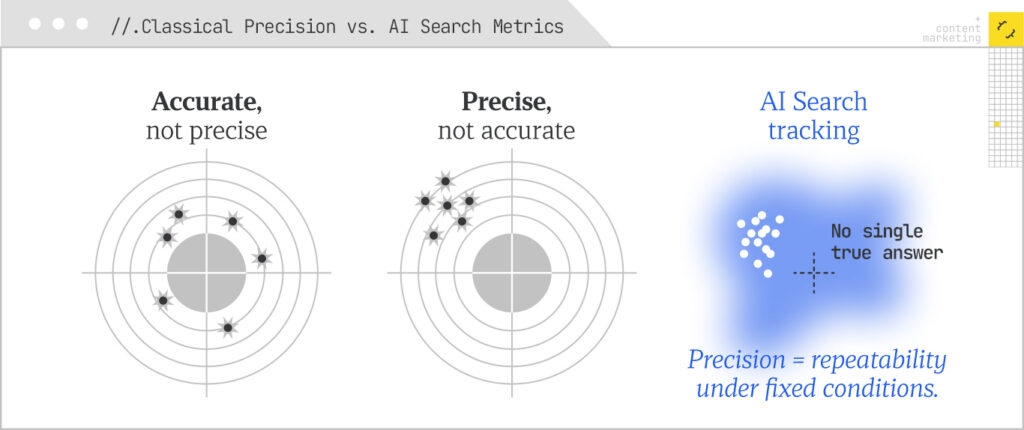
What can exist is precision. You can build an instrument that, given the same conditions, produces the same reading. You can characterize how much it wobbles. You can hold it steady over time so that when the reading changes, you know the world changed and not your ruler.
If you’ve worked with any measurement system built on top of a population you can’t fully observe, this should feel familiar. Nobody knows exactly how many people watched a given television broadcast. Nielsen doesn’t claim to know. It runs a panel with a documented methodology, the industry agrees to treat the panel’s output as the currency, and the value of the number comes from its consistency rather than its truth. Political polling is the same. A poll with a ±3 point margin of error isn’t “accurate” in any absolute sense. It’s a sample with a known precision from a method that gets held constant so the trend line means something.
You don’t even have to leave our industry for the example. Search Console and Google Analytics have never agreed on organic traffic and never will, and I wrote a whole post on why. Search Console is built from Google’s query and click logs. Analytics is JavaScript firing in a browser after the click. They define a session differently, one reports canonical URLs and the other reports whatever actually loaded, and they filter bots and handle time zones by their own rules. A Search Console click is not a Google Analytics session. The disparity is by design. No one should ask which of the two is “accurate.” You learn what each one measures, you pick the one that answers your question, and you never build a trend line by switching between them.
AI search tracking is a polling problem. The industry keeps trying to sell it as a scale.
The Decisions That Are Actually the Measurement
Every visibility number you’ve ever looked at is downstream of a handful of methodological choices. Let’s go through the big ones and be clear about what each one is actually measuring, because none of them is “the truth” and all of them are defensible for different reasons.
Scraping vs. API
There are fundamentally two ways to get a response out of an AI system at scale: you can drive the consumer product like a user would (scraping, whether through browser automation or reverse-engineered endpoints), or you can call the developer API.
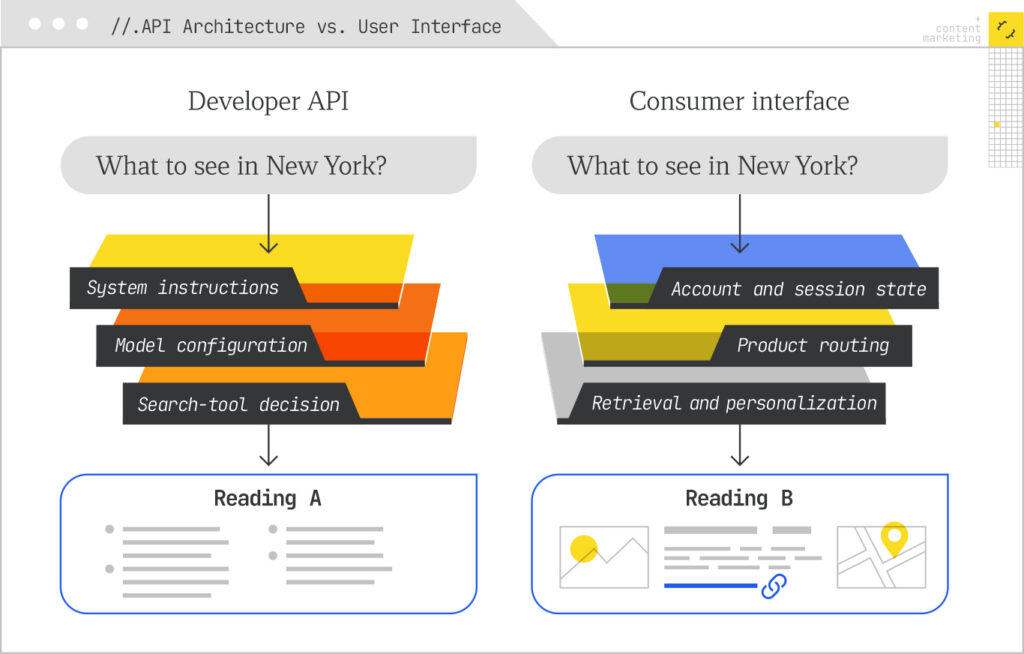
People talk about this as an engineering trade-off. Reliability, cost, terms of service. It is those things. But it’s first and foremost a question of what system you’re observing, because the API and the consumer product are not the same system.
When you hit OpenAI’s API with a web search tool enabled, you are running a model with your system prompt, your tool configuration, and your decision about when search fires. The consumer ChatGPT product runs a different build with its own instructions, its own routing between models and reasoning modes, its own logic about whether a query even warrants a search, and its own interface features (shopping modules, source carousels, follow-up suggestions) that don’t exist in a text completion. You can use the same nominal model on both and get materially different answers, because the model is only one component of the product.
This is the Search Console versus Analytics split all over again. One instrument reads the system from the inside, through its own logs and its own plumbing. The other reads it from the surface, where the user is standing. Same underlying event, two structurally different views, and the gap between them is not a bug anyone is going to fix.
Google makes this simpler by making it impossible. There is no developer API for AI Overviews or AI Mode. The Gemini API with search grounding is not AI Mode, no matter how much a tool’s marketing implies otherwise. It’s a different system with a different retrieval pipeline and none of the personalization machinery. If a vendor tells you they track AI Mode via API, ask them which API. There isn’t one. What they’re doing is either scraping or approximating.
Perplexity does offer an API, and it’s a good bit closer to the consumer product than most. In fact, that’s what the original Generative Engine Optimization white paper did its experiments on, but it still isn’t the thing a logged-in user sees at perplexity.ai.
So the API camp is measuring something like the model’s grounded behavior under controlled conditions. It’s stable, it’s reproducible, it scales cheaply, and it is unambiguously not what any human being is looking at from the LLM’s interface. The scraping camp is measuring something like what one particular synthetic user sees from one particular IP with one particular account state at one particular moment. It’s closer to the surface humans touch, and it is fragile, expensive, hostage to bot detection, and every bit as much a single point in a distribution as the API call is.
Neither is accurate. They are two different instruments pointed at two different things. The mistake isn’t picking one. The mistake is comparing a number from one to a number from the other and concluding one of them is wrong. That’s Fahrenheit and Celsius arguing about the weather.
Logged In vs. Logged Out
This is the one where the industry has two loud camps and both of them are half right.
Camp one says: logged-out sessions get routed to more limited model configurations, with more restrictive tool use and frequently no web search at all. Most real users, including free users, are logged in and getting a stronger model with memory and personalization. So logged-out data is measuring a product almost nobody uses.
Camp two says: logged-in sessions are personalized to the account, so whatever you measure from a logged-in account is measuring that account, not a population. Logged-out is the closest thing to a neutral baseline you’re going to get.
Both of those are true, and neither of them gets you to “accurate,” because there is no neutral user. Here’s the trap that camp one walks into. Say you build a logged-in tracking account and start firing thousands of prompts through it. ChatGPT’s memory system synthesizes context across conversations, and reference chat history is a real thing. Congratulations, you have now built an account whose “personalization” is being a bot that asks about CRMs and mattresses all day. Your instrument is contaminating itself. The observer effect isn’t a metaphor here; it’s a product feature.

The fixes all push you back toward synthetic. You use temporary chats, which don’t read or write memory. You turn memory off. You rotate fresh accounts. You build persona accounts with seeded histories to simulate a segment. Every one of these is a legitimate methodological choice, and every one of them means you are no longer measuring “what logged-in users see.” You’re measuring what a specific, constructed logged-in user sees. Which is fine! But call it what it is.
The right way to think about this axis isn’t “which one is real?” It’s “what am I proxying?” Logged-out with memory-free sessions is a decent proxy for the model’s uncontaminated prior, the floor of what it says about your category before it knows anything about the person asking.
Logged-in persona accounts are scenario analysis, the persistent-profile approach I was pushing for rank tracking six years ago, except now it’s mandatory instead of optional: what does the system say to someone who looks like our enterprise buyer, versus someone who looks like a student? Those are both useful. They answer different questions, and neither of them is the answer.
Single Collection vs. Multiple Collections
This is the one that matters most and gets talked about least, because it’s the one that costs money.
Most tracking setups run each prompt once per collection cycle. Once a day, once a week, whatever. One prompt, one response, one data point. Then that data point goes into a dashboard as though it were a fact: you were mentioned or you weren’t.
Given everything above about nondeterminism, think about what that single response actually is. It’s one draw from a distribution. If your brand appears in 60% of the responses that prompt could generate, a single-run tracker will tell you “yes” on Monday and “no” on Tuesday, and your dashboard will render that as a visibility drop, and someone will get an email about it, and somebody will change something on the website in response to a coin flip.
The data on this is not subtle. Earlier this year Mike Sonders ran twelve buyer-intent prompts through logged-out ChatGPT one hundred times each, from different IPs, and published the results on Search Engine Land. Across 100 runs of a single prompt, ChatGPT mentioned around 44 different brands. Any individual response named about ten of them. Only about five brands per prompt — roughly 11% of the pool — showed up 80% of the time or more. In competitive categories, 72% of the brands that got mentioned at all appeared in fewer than one in five responses.
Read that again from the perspective of the single-run tracker. For most brands in most categories, whether you “appear” for a given prompt on a given day is closer to a dice roll than a ranking. A tool that samples once and reports a binary is reporting the dice roll as a fact.

Multiple collections fix this the only way it can be fixed: by turning a binary into a rate. Run the prompt twenty times and you can say “we appeared in 12 of 20,” and now you have an estimate of your actual appearance probability with a margin of error you can compute. The math is just the binomial standard error, and it’s worth having a feel for. At a true appearance rate around 50%, five runs gives you a 95% confidence interval of roughly ±44 points, which is barely better than nothing. Ten runs gets you to about ±31. Twenty runs, ±22. Fifty, ±14. A hundred, ±10.
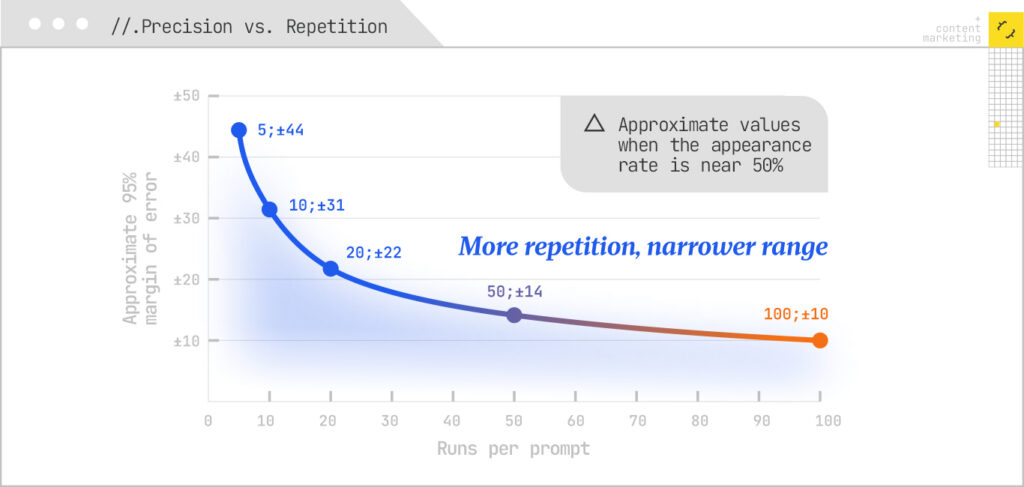
Those numbers should reframe how you think about tool pricing. When a vendor says they track 500 prompts daily and another says they track 100 prompts with ten runs each, the second one is doing more measurement, not less, even though the first one’s number is bigger. Single collection isn’t a methodology. It’s a cost-saving measure that gets presented as one.
And “multiple collections” isn’t only about repetition. The Semrush research team published a study in June comparing ChatGPT’s Instant and Thinking modes across the same 100 prompts and found that only about a quarter of cited domains overlapped between the two. Thinking mode issued more than four times as many fan-out queries, cited nearly twice as many sources per response, and pulled from 99 domains that never appeared in Instant mode at all. Same product, same prompts, same day.
So, which mode is your tracker running? Do you know? Does the vendor say?
Then there’s the prompt itself. Jan Ehrlinspiel, Malte Landwehr, and Tomek Rudzki put out a working paper on SSRN analyzing nearly 38,000 responses across five engines, and found that brand visibility held steady when prompt rewordings stayed somewhat semantically close (cosine similarity above roughly 0.5 to 0.6) and fell by about half when the phrasing drifted further. Ranking-style prompts surfaced up to 20% more brands than open-ended ones. Which means your prompt set is also a methodological choice with a variance attached to it, and the person who wrote your prompts has more influence over your visibility score than your content team does.
The Axes Nobody Puts on the Pricing Page
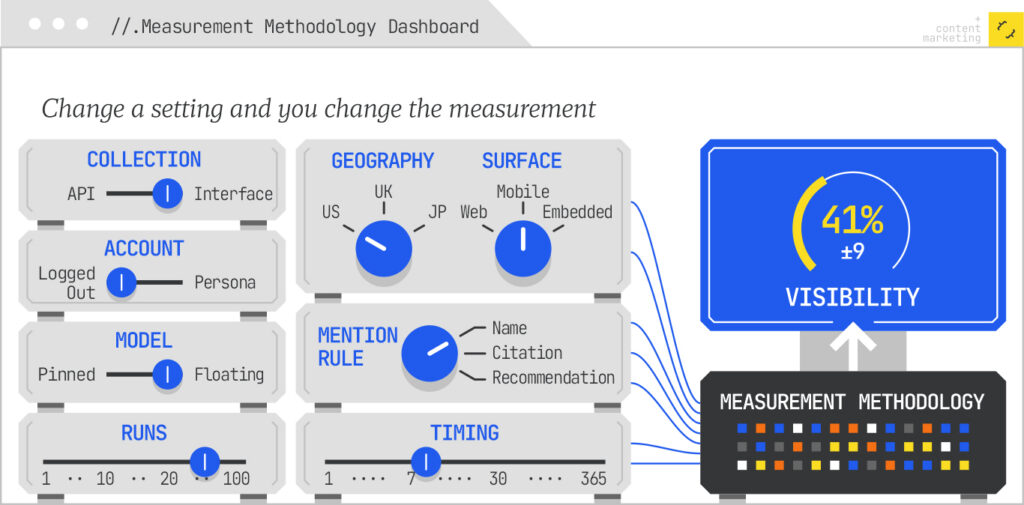
Scraping/API, logged in/out, and run count are the big three, but they’re not the whole list. Geography matters, because the IP and the account’s location shape retrieval and personalization, and a tracker in a Virginia data center is not a buyer in Tokyo.
Device and surface matter, because the mobile app, the web app, and the embedded experience in a browser or an operating system don’t behave identically.
Time matters, because indices refresh and models get silently updated, and a Tuesday morning collection and a Friday night collection are sampling different systems.
And the definition of the thing you’re counting matters enormously: is a “mention” a brand name in the prose, a cited URL, a recommendation in a list, a link in a shopping module? Is a mention of your product with your competitor’s name attached a win?
Two tools can look at the identical response and disagree about whether you’re in it. We lived through this with SERP features, too. For years some rank trackers counted a featured snippet as position zero and others counted it as position one, so two tools would report different rankings for the same page on the same SERP, and both were correct by their own definitions.
Every one of these is a place where a number gets manufactured. None of them is wrong. All of them need to be disclosed, and almost none of them are.
Why This Isn't Academic
I can hear it. “Mike, fine, it’s noisy, but directionally it’s useful, we get it.” Siiiigh. Let’s talk about what precision actually buys you and what its absence actually costs, because this changes what you should do next Monday.
Precision Determines What You Can Detect
Every instrument has a minimum detectable effect, the smallest real change it can distinguish from noise. If your single-run tracker’s inherent wobble is ±40 points on a given prompt, and your content program lifts your true appearance rate from 35% to 50%, you cannot see it. Not “it’s hard to see.” You cannot see it. The signal is inside the noise. You will run a successful program and conclude it didn’t work, or run a failed one and conclude it did, and both conclusions will look like data. The number of runs you collect isn’t a data-quality nicety. It sets the floor on what you’re capable of learning.
Trend Integrity Depends on Holding the Instrument Still
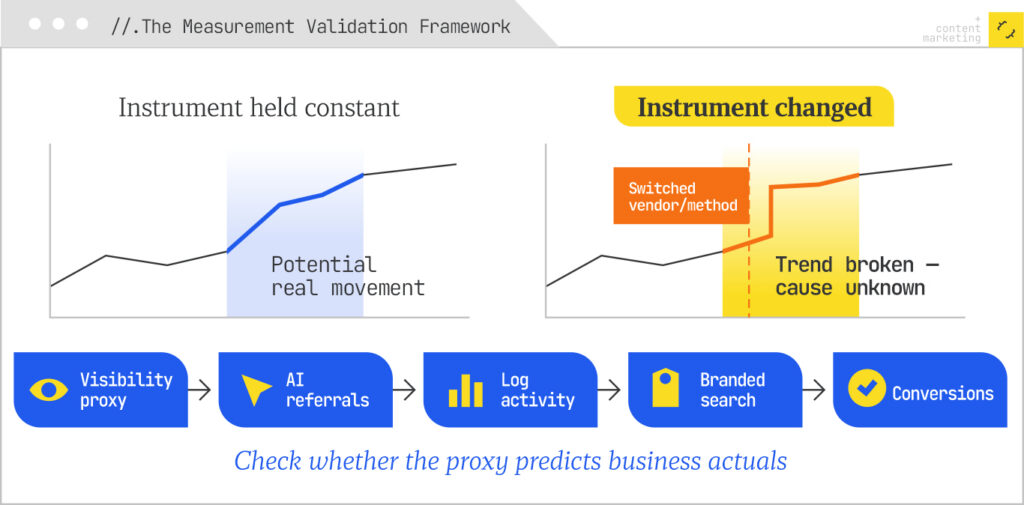
The value of any of these measurements is longitudinal. You want to know if you’re moving. But you can only attribute a change in the reading to a change in the world if the instrument didn’t change.
Switch from API to scraping, switch from logged-out to persona accounts, switch vendors, let the vendor switch models on you without telling you, and the trend line breaks. You’ll see a “drop” in March that is actually a methodology change, and you’ll never know. This is why I tell clients that the worst thing you can do with AI visibility tracking is shop around every quarter.
The second worst is to use a tool that doesn’t publish a methodology changelog. Years ago, I recommended annotating your analytics with the release date of every browser privacy update so you could tell an anomaly from a trend. Same discipline here, with the added wrinkle that this time your vendor might be the one quietly changing the instrument.
Cross-Tool Comparison is a Fiction
Back to the board deck problem. Two tools disagree. They will always disagree, because they are different instruments sampling a distribution under different conditions. Not only is neither one “right,” the disagreement itself carries no information about which is better.
Anyone who has run Google Analytics and Adobe Analytics side by side on the same site knows this in their bones. They define a session differently, they define a user differently, they handle bots and consent and time zones by their own rules, and they have never once produced the same number. Nobody concluded one of them was broken. The enterprise picked a system of record and got on with life.
The way to evaluate a tool isn’t to check its number against another tool’s number. It’s to check whether it’s precise: run the same prompt set twice under the same conditions and see how much the readings move. A tool whose own readings wobble 30 points between identical collections is telling you something about itself that no comparison to a competitor ever will.
Point Estimates are Lies of Omission
“You appear in 41% of tracked prompts” is a sentence that hides everything that matters. Forty-one percent of one run each? Of ten? On which mode? From where? The honest version is “we appear in roughly 41% of responses, ±9 points, across 20 runs per prompt, logged-out, US, Thinking mode, week of August 25.” That sentence is uglier. It’s also the only version that a competent analyst can act on, because it tells you whether the 45% you see next month is movement or noise.
The Only "Actuals" You Have Live Somewhere Else
Here’s the part where the accuracy people have a point, just not the one they think. There are true values in this system. They’re just not visibility numbers. Your referral traffic from AI surfaces is a true value. The crawler and user-agent hits in your logs are true values. Assisted conversions, branded search lift, pipeline that mentions ChatGPT in the “how did you hear about us” field, those are real. Real, not complete.
As I once said, your analytics data has never been 100% of what happens on your site and it’s only getting worse, between ad blockers, consent banners, Safari’s cookie expiry, and modeled conversions filling in the gaps. But an undercount of events that actually happened is a fundamentally different animal from a sample of a stochastic process. One has a true value you’re approaching from below. The other doesn’t have one at all.
In the measurement framework we use at iPullRank, visibility metrics are channel metrics, and they’re proxies. Performance metrics are the actuals. The job of a precise visibility instrument isn’t to be true. It’s to move in a consistent relationship with the things that are, so you can use it as a leading indicator. If your visibility tracker goes up and your AI-referred traffic and log data don’t follow over a reasonable window, the tracker isn’t wrong. It’s measuring something that doesn’t connect to your business, and that’s a much more important thing to know.
What This Means for How You Buy and Build
If you’re evaluating a platform, or building your own collection, the questions to ask are not “how accurate are you.” They are questions about the instrument.
Ask how responses are collected, API or interface, and for which platforms specifically. A vendor that says “API” for Google is telling you they’re not measuring AI Mode. Ask about account state: logged out, logged in, memory on or off, temporary chats, account rotation. Ask which model and which mode, and whether that’s pinned or floating, and whether you’ll be notified when it changes. Ask how many runs per prompt per collection, and whether the dashboard reports a rate with a range or a binary. Ask where the requests originate geographically and whether you can control it. Ask what counts as a mention, and whether you can see the raw responses to audit that definition yourself. Ask for the methodology changelog. Ask whether you can export everything, because the day you leave, your history walks out with the instrument.
And take anything labeled “prompt volume” as an estimate of an estimate. Nobody outside the platforms has the query logs. Whatever number you’re being shown is a model of a model, and its precision is nobody’s to guarantee.
If you’re building your own, the principles are the same and the budget conversation is more honest. Decide what you’re proxying, uncontaminated baseline or constructed persona, and write it down, because an atomic understanding of your own methodology is the only thing that lets you defend a number six months from now. Pin your configuration. Run enough repetitions to get your confidence interval below your minimum interesting effect. If a five-point move is what you’d act on, twenty runs isn’t a luxury. Store raw responses, not just extracted metrics, because your definition of a mention will change and you’ll want to recompute history. Track your own instrument’s precision as a metric: collect the same set twice under identical conditions periodically and report the drift. And couple the whole thing to your actuals so you find out early whether the proxy is connected to anything.
The Number Was Never the Point
The instinct to want an accurate number is the instinct of an industry that grew up staring at a rank tracker that felt like a fact. Position three was position three. You could screenshot it. It was never quite as solid as it looked, but it was solid enough that we built careers on pretending.
AI search doesn’t offer that comfort, and I’d argue it’s doing us a favor. Rankings were always a proxy that we mistook for the thing itself. The new environment forces the question we should have been asking all along: not “what’s the number,” but “what am I measuring, how repeatable is the measurement, and what does it predict about the business?”
That’s Relevance Engineering. It’s the discipline of treating this like the experiment it is, instead of a scoreboard. It means designing your instrument before you read from it, holding it still long enough to learn something, and reporting ranges when ranges are the truth. It means being the person in the room who says “that’s within the noise” when everybody else is panicking about a three-point dip, and the person who says “that’s real, and here’s the interval” when it’s time to take credit.
There’s no accuracy in AI search tracking. There’s a distribution, there are samples, and there’s the craft of how you take them. Get precise about that, and stop asking which tool is right.