
The transition from traditional SEO to GEO has reshaped what it means to measure “visibility.” The difficulty here is twofold. First, generative answer layers often don’t exist in the analytics tools we’ve relied on for two decades. Second, even when we can detect them, they’re not stable: A query you monitor today may return a different set of citations in a subsequent prompt, even with no visible change in your content. The challenge for GEO practitioners is to build measurement systems that illuminate this hidden layer, track it over time, and link those appearances to actionable outcomes.
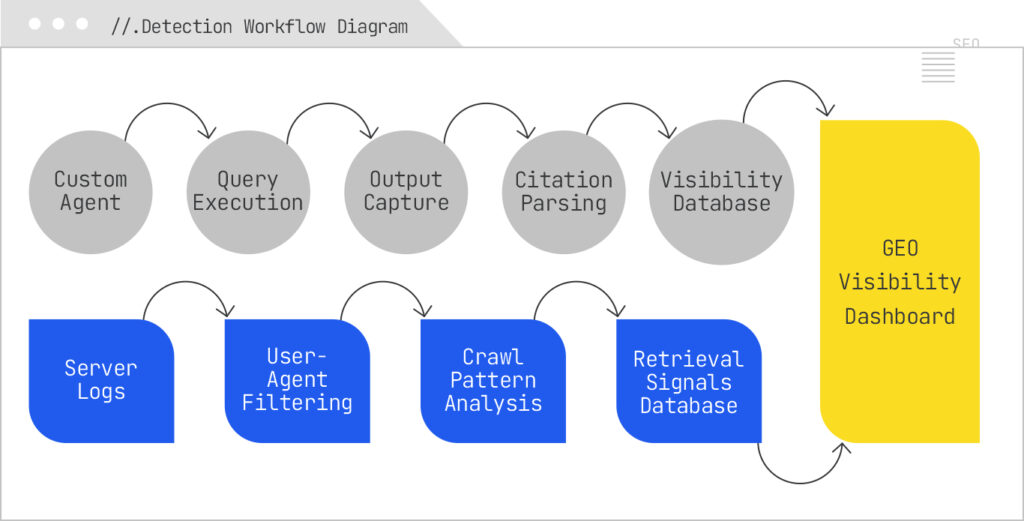
The most effective GEO visibility programs combine active detection and passive detection methods. Active detection uses custom monitoring agents or software you control that queries AI Search systems, captures their answers, and analyzes them for references to your domain. Passive detection involves analyzing your own server logs to spot retrieval behavior from AI crawlers.
Custom agents can be as simple as a script that uses browser automation (Puppeteer, Playwright, Selenium) to run a query list and take a screenshot, or as complex as a full data pipeline that captures HTML/JSON responses, parses them, and stores structured citation data. The sophistication matters because AI answers change. For this reason, agents should be scheduled to run queries multiple times a day, capturing not only whether you were cited, but also the variability in citation sets over time. That volatility data can be valuable in its own right, especially when correlated with changes in your content or in the broader competitive landscape.
Log-file analysis complements this by showing you when an AI system has fetched your content. For example, if PerplexityBot hits your site twice as often in a given week, and you notice a corresponding increase in Perplexity citations in your active monitoring, you’ve uncovered a retrieval-citation relationship. Advanced log parsing can even group bot hits by target URL, revealing which pages the AI systems consider most relevant to the queries you’re targeting.
Here’s a list of the known AI Search bots that actively crawl and index content for use in generative search experiences. These user agents represent the retrieval layer of various AI platforms, from large conversational models like ChatGPT and Copilot to transparent answer engines such as Perplexity. By identifying and monitoring these bots in your server logs, you can better understand when and how your content is being accessed for potential inclusion in AI-generated responses. This visibility is critical for GEO analysis, because fluctuations in crawl activity can signal changes in retrieval eligibility, shifts in ranking priorities, or evolving index coverage. Keeping an up-to-date inventory of these user agents, and correlating their visits with changes in your generative search presence, provide one of the few measurable touchpoints in an otherwise opaque AI retrieval process.
Vendor | User agent/token (what you’ll see) | What it does | How to control | Notes/docs |
OpenAI | GPTBot | Training/collection crawler for OpenAI models | User agent: GPTBot in robots.txt | Official OpenAI bots page lists GPTBot and control syntax OpenAI Platform |
| OAI-SearchBot | Fetches content to surface and link sites in ChatGPT’s search features; not for training | User agent: OAI-SearchBot | Explicitly documented by OpenAI OpenAI Platform |
| ChatGPT-User | On-demand fetcher when a ChatGPT session, custom GPT, or tool asks to load a URL | User agent: ChatGPT-User | Behaves like a browser agent for user-initiated retrieval; OpenAI and third-party guidance document its control DaydreamOpenAI Platform |
Anthropic (Claude) | ClaudeBot | Broad web crawling to improve Claude; training-oriented | User agent: ClaudeBot | Official help article clarifies purpose and robots control Anthropic Help Center |
| Claude-User | User-triggered fetching when a person asks Claude to visit a page. | User-agent: Claude-User | Separate from training bot; used during chats Anthropic Help Center |
Perplexity AI | PerplexityBot | Crawler for indexing the web to power Perplexity’s answer engine | User-agent: PerplexityBot (see also published IP list) | Official bot page and JSON of IPs; recent reports allege stealth UA impersonation when blocked |
| Perplexity-User | User-driven fetcher during an answer session; not for model training. | User-agent: Perplexity-User | Documented as request-time retrieval, not corpus crawling Perplexity |
(Gemini/ AI Overviews) | Google-Extended (robots token) | Opt-out token controlling whether Google may use your site for AI model training/AI features beyond standard search | User-agent: Google-Extended | Robots token, |
| Googlebot family (Googlebot, Googlebot-Image, Googlebot-Video, Googlebot-News, etc.) | Actual HTTP fetchers for search and features that also supply content to generative products | Use respective user-agent names in robots.txt. | Comprehensive list and behavior in Search Central docs Google for Developers |
Apple (Apple Intelligence) | Applebot | General crawler supporting Siri/Spotlight and Apple services | User-agent: Applebot | Standard Apple crawling Apple Support |
| Applebot-Extended (robots token) | Governs use of your content for training Apple’s foundation models | User-agent: Applebot-Extended | Apple documents opt out explicitly |
Microsoft/ Bing/ Copilot | bingbot (various modern UA strings) | Core Bing crawler; content may be used in Copilot/answers | User-agent: bingbot | Official UA formats documented |
You.com | YouBot | Crawler for You.com’s AI assistant and search | User-agent: YouBot | Seen in multiple bot directories |
Cohere | cohere-training-data-crawler | Training crawler for Cohere LLMs. | User-agent: cohere-training-data-crawler | Documented in bot directories; widely observed |
| cohere-ai | Likely on-demand fetcher associated with chat products | User-agent: cohere-ai | Marked as unconfirmed; treat as |
Common Crawl | CCBot | Open web crawl used as upstream data for many AI models and research | User-agent: CCBot | Allow/disallow |
Allen Institute (AI2/Semantic Scholar) | AI2Bot | Research crawler powering Semantic Scholar and related AI research uses | User-agent: AI2Bot | Often permitted for academic purposes |
Meta | FacebookBot, facebookexternalhit, meta-externalagent | Social preview fetchers; content may inform Meta AI features | User-agents as listed | Primary purpose is previews; policy landscape is evolving for AI usage |
ByteDance (TikTok, Toutiao, CapCut) | Bytespider | Broad crawler; content can feed TikTok/AI features | User-agent: Bytespider | Frequently seen; controllable via robots |
Amazon | Amazonbot | Amazon’s crawler; supports various AI-enabled experiences | User-agent: Amazonbot | Official bot page provides details |
DuckDuckGo | DuckAssistBot | Fetcher associated with DuckAssist answer feature | User-agent: DuckAssistBot | Visibility in bot directories; DuckDuckGo positions |
Diffbot | Diffbot | ML extraction service often used in AI data pipelines | User-agent: Diffbot | Converts pages to structured data |
Omgili (forums) | omgili | Forum/discussion indexer used by data vendors and AI pipelines | User-agent: omgili | Common in conversation-scraping |
Timpi (decentralized search) | Timpibot/TimpiBot | Decentralized indexer; appears in AI search startup stacks |
|
|
While both AI Overviews and AI Mode are powered by Google’s generative systems, they are distinct environments that require separate detection strategies.
AI Overviews show up in a panel embedded within a traditional SERP. It’s triggered selectively, often for queries where Google believes a synthesized answer will improve the search experience. Detecting it involves running your target queries in Google Search, capturing the SERP DOM, and parsing for the presence of the Overview block. Within that block, you’re looking for anchor tags pointing to your domain, as well as textual matches to your content. The key is that the Overview can appear or disappear for the same query based on user context, testing conditions, or model updates. So a single spot-check isn’t enough: You need longitudinal data to understand your true visibility.
AI Mode is different. It lives in its own conversational interface, and the retrieval behavior is broader and more reasoning-driven. Running the same query in AI Mode can return citations from entirely different sources than an AI Overview will use. This is partly because AI Mode’s objective is to sustain a multi-turn dialogue, not just summarize. Detecting citations here means capturing the full conversation output (often longer and more complex) and extracting every linked source. Comparing this to AI Overview results can therefore uncover platform biases, preferred sources, and thematic-coverage gaps that affect your inclusion rate.
FetchSERP exposes representational state transfer (REST) endpoints for classic SERP data and, importantly for Generative Engine Optimization (GEO), AI Overviews and AI Mode. Their /api/v1 family includes serp, serp_js, serp_ai, and serp_ai_mode. For GEO monitoring, we focus on the two AI-specific endpoints:
All requests require your API token in the Authorization: Bearer token header. You pass the search query and optionally country (default us).
Each results sheet has a timestamp column in the first position. Every run appends new rows with the current date/time so you can build a time-series dashboard showing changes in visibility over days, weeks, or months.
This means you can:
The chart on GEO_AISummary starts as a snapshot view, but with the time-stamped data, you can easily pivot by date to show rolling counts or share of voice over time.
The script loops through your keywords, calls both endpoints, normalizes the results, and appends them to the appropriate sheets with the current timestamp.
/**
 * FetchSERP → Google Sheets tracker for AI Overviews (AIO) and AI Mode
 * with rank-like signals and brand presence pivot.
 *
 * Tabs expected/created:
 *  - Keywords: column A header "keyword", then one query per row.
 *  - Brands: column A header "domain" (your brand domains, no www).
 *  - AIO_Results: appended per run (presence + top domains).
 *  - AI_Mode_Results: appended per run (presence + top domains).
 *  - AI_Sources: appended per run (1 row per citation with rank and metadata).
 *  - GEO_AISummary: summary counts + chart (AIO vs AI Mode triggers).
 *  - GEO_BrandPresence: pivot for latest run + chart of rank-1 shares.
 */

const FETCHSERP_BASE = 'https://www.fetchserp.com/api/v1';
const DEFAULT_COUNTRY = 'us';

function onOpen() {
  SpreadsheetApp.getUi()
    .createMenu('GEO (FetchSERP)')
    .addItem('Fetch AIO & AI Mode', 'runAIOTracking')
    .addToUi();
}

function runAIOTracking() {
  const ss = SpreadsheetApp.getActiveSpreadsheet();
  const token = getApiToken_();
  const keywords = getKeywords_(ss);
  ensureBrandsSheet_(ss); // make sure Brands exists (empty is fine)

  const aioSheet = ensureSheet_(ss, 'AIO_Results', [
    'timestamp', 'keyword', 'country',
    'has_ai_overview', 'source_count', 'top_source_domain', 'all_sources'
  ]);

  const aimodeSheet = ensureSheet_(ss, 'AI_Mode_Results', [
    'timestamp', 'keyword', 'country',
    'has_ai_mode', 'source_count', 'top_source_domain', 'all_sources'
  ]);

  const srcSheet = ensureSheet_(ss, 'AI_Sources', [
    'timestamp', 'keyword', 'country', 'surface', // AIO or AI_MODE
    'rank', 'url', 'domain', 'title', 'site_name'
  ]);

  const now = new Date();
  const aioRows = [];
  const aimodeRows = [];
  const sourceRows = [];

  for (const kw of keywords) {
    const country = DEFAULT_COUNTRY;

    // Primary combined endpoint
    const aiData = callFetchSerp_('serp_ai', { query: kw, country }, token);

    // Optional AI Mode accelerator (US-only, cached)
    let aiModeData = null;
    try {
      aiModeData = callFetchSerp_('serp_ai_mode', { query: kw }, token);
    } catch (e) {
      // OK to ignore; not always necessary
    }

    // ---- AI OVERVIEW ----
    const aioBlock = getBlock_(aiData, 'ai_overview');
    const aioSources = normalizeSources_(aioBlock && aioBlock.sources);
    const aioTop = aioSources.length ? aioSources[0] : null;
    aioRows.push([
      now, kw, country,
      !!aioBlock,
      aioSources.length,
      aioTop ? domainOnly_(aioTop.url || aioTop.site_name || '') : '',
      aioSources.map(s => domainOnly_(s.url || s.site_name || '')).join(' | ')
    ]);

    // push detailed sources with rank
    aioSources.forEach((s, i) => {
      sourceRows.push([
        now, kw, country, 'AIO',
        i + 1,
        s.url || '',
        domainOnly_(s.url || s.site_name || ''),
        s.title || '',
        s.site_name || ''
      ]);
    });

    // ---- AI MODE ----
    const aiModeBlock = extractAiMode_(aiModeData) || extractAiMode_(aiData);
    const aimSources = normalizeSources_(aiModeBlock && aiModeBlock.sources);
    const aimTop = aimSources.length ? aimSources[0] : null;
    aimodeRows.push([
      now, kw, country,
      !!aiModeBlock,
      aimSources.length,
      aimTop ? domainOnly_(aimTop.url || aimTop.site_name || '') : '',
      aimSources.map(s => domainOnly_(s.url || s.site_name || '')).join(' | ')
    ]);

    aimSources.forEach((s, i) => {
      sourceRows.push([
        now, kw, country, 'AI_MODE',
        i + 1,
        s.url || '',
        domainOnly_(s.url || s.site_name || ''),
        s.title || '',
        s.site_name || ''
      ]);
    });

    Utilities.sleep(400); // rate-friendly
  }

  if (aioRows.length) appendRows_(aioSheet, aioRows);
  if (aimodeRows.length) appendRows_(aimodeSheet, aimodeRows);
  if (sourceRows.length) appendRows_(srcSheet, sourceRows);

  buildSummaryAndChart_();
  buildBrandPresencePivotAndChart_(); // NEW
}

/* ----------------------- Helpers & Builders ----------------------- */

function getApiToken_() {
  const props = PropertiesService.getScriptProperties();
  const token = props.getProperty('FETCHSERP_API_TOKEN') || '';
  if (!token) {
    throw new Error('Missing FETCHSERP_API_TOKEN in Script properties. Set it in Project Settings.');
  }
  return token;
}

function getKeywords_(ss) {
  const sh = ss.getSheetByName('Keywords');
  if (!sh) throw new Error('Missing "Keywords" sheet with header "keyword" in A1.');
  const values = sh.getRange(2, 1, Math.max(0, sh.getLastRow() - 1), 1)
    .getValues().flat().map(String).map(s => s.trim()).filter(Boolean);
  if (!values.length) throw new Error('No keywords found under header "keyword" (A2:A).');
  return values;
}

function ensureSheet_(ss, name, headers) {
  let sh = ss.getSheetByName(name);
  if (!sh) sh = ss.insertSheet(name);
  if (sh.getLastRow() === 0) {
    sh.getRange(1, 1, 1, headers.length).setValues([headers]);
    sh.setFrozenRows(1);
  }
  return sh;
}

function ensureBrandsSheet_(ss) {
  let sh = ss.getSheetByName('Brands');
  if (!sh) {
    sh = ss.insertSheet('Brands');
    sh.getRange(1, 1).setValue('domain');
    sh.setFrozenRows(1);
  }
  return sh;
}

function callFetchSerp_(path, params, token) {
  const url = `${FETCHSERP_BASE}/${path}?` + Object.keys(params)
    .map(k => `${encodeURIComponent(k)}=${encodeURIComponent(params[k])}`).join('&');

  const res = UrlFetchApp.fetch(url, {
    method: 'get',
    headers: { 'accept': 'application/json', 'authorization': `Bearer ${token}` },
    muteHttpExceptions: true
  });

  const code = res.getResponseCode();
  const text = res.getContentText();
  if (code < 200 || code >= 300) throw new Error(`FetchSERP ${path} error ${code}: ${text}`);

  try { return JSON.parse(text); }
  catch (e) { throw new Error(`FetchSERP ${path} invalid JSON: ${text.slice(0, 300)}…`); }
}

function getBlock_(payload, key) {
  if (!payload) return null;
  const d = payload.data || payload;
  if (d.results && d.results[key]) return d.results[key];
  if (d[key]) return d[key];
  return null;
}

function extractAiMode_(payload) { // tolerate different shapes
  if (!payload) return null;
  const d = payload.data || payload;
  if (d.results && d.results.ai_mode) return d.results.ai_mode;
  if (d.ai_mode) return d.ai_mode;
  return null;
}

function normalizeSources_(sources) {
  if (!Array.isArray(sources)) return [];
  return sources
    .map(s => s || {})
    .map(s => ({
      url: s.url || '',
      title: s.title || '',
      site_name: s.site_name || ''
    }))
    .filter(s => s.url || s.site_name);
}

function domainOnly_(u) {
  try {
    const host = (new URL(u)).hostname || '';
    return host.replace(/^www\./i, '');
  } catch (e) {
    return (u || '').replace(/^www\./i, '');
  }
}

function appendRows_(sheet, rows) {
  sheet.getRange(sheet.getLastRow() + 1, 1, rows.length, rows[0].length).setValues(rows);
}

/** Create or refresh a historical summary tab with counts & share of voice, plus trend chart. */
/** Create or refresh a historical summary tab with counts, SOV, and 7-day rolling averages, plus a trend chart. */
function buildSummaryAndChart_() {
  const ss = SpreadsheetApp.getActiveSpreadsheet();
  const sum = ensureSheet_(ss, 'GEO_AISummary', [
    'date',
    'AIO_count', 'AIO_share_of_voice',
    'AI_Mode_count', 'AI_Mode_share_of_voice',
    'keywords_tracked',
    'AIO_count_7dma', 'AI_Mode_count_7dma',
    'AIO_sov_7dma', 'AI_Mode_sov_7dma'
  ]);

  // Clear old rows (keep header)
  if (sum.getLastRow() > 1) {
    sum.getRange(2, 1, sum.getLastRow() - 1, 11).clearContent();
  }

  const aio = ss.getSheetByName('AIO_Results');
  const aim = ss.getSheetByName('AI_Mode_Results');
  const kwSheet = ss.getSheetByName('Keywords');
  if (!aio || !aim || !kwSheet) return;

  const keywordsTracked = Math.max(0, kwSheet.getLastRow() - 1);

  // Build daily counts maps
  const aioCounts = countByDate_(aio, 1, 4); // timestamp col 1, has_ai_overview col 4
  const aimCounts = countByDate_(aim, 1, 4); // timestamp col 1, has_ai_mode col 4

  const allDates = Array.from(new Set([...Object.keys(aioCounts), ...Object.keys(aimCounts)]))
    .sort((a, b) => new Date(a) - new Date(b));

  // Build rows with daily values first
  const rows = allDates.map(date => {
    const aCount = aioCounts[date] || 0;
    const mCount = aimCounts[date] || 0;
    const aSOV = keywordsTracked ? aCount / keywordsTracked : 0;
    const mSOV = keywordsTracked ? mCount / keywordsTracked : 0;
    return [
      date,
      aCount, aSOV,
      mCount, mSOV,
      keywordsTracked,
      null, null, // AIO_count_7dma, AI_Mode_count_7dma (fill after)
      null, null  // AIO_sov_7dma, AI_Mode_sov_7dma (fill after)
    ];
  });

  // Compute 7-day rolling averages (centered on the last 7 days ending at index i)
  const aCountSeries = rows.map(r => r[1]);
  const mCountSeries = rows.map(r => r[3]);
  const aSovSeries   = rows.map(r => r[2]);
  const mSovSeries   = rows.map(r => r[4]);

  const aCount7 = rollingMean_(aCountSeries, 7);
  const mCount7 = rollingMean_(mCountSeries, 7);
  const aSov7   = rollingMean_(aSovSeries,   7);
  const mSov7   = rollingMean_(mSovSeries,   7);

  // Fill the rolling columns
  for (let i = 0; i < rows.length; i++) {
    rows[i][6]  = aCount7[i]; // AIO_count_7dma
    rows[i][7]  = mCount7[i]; // AI_Mode_count_7dma
    rows[i][8]  = aSov7[i];   // AIO_sov_7dma
    rows[i][9]  = mSov7[i];   // AI_Mode_sov_7dma
  }

  if (rows.length) {
    sum.getRange(2, 1, rows.length, rows[0].length).setValues(rows);
  }

  // Rebuild chart: daily counts + smoothed SOV on dual axes
  const charts = sum.getCharts();
  charts.forEach(c => sum.removeChart(c));

  const dataHeight = rows.length + 1; // include header
  const chart = sum.newChart()
    .setChartType(Charts.ChartType.LINE)
    .addRange(sum.getRange(1, 1, dataHeight, 10)) // includes counts, SOV, and 7d SOV
    .setPosition(5, 1, 0, 0)
    .setOption('title', 'AIO & AI Mode — Daily Counts and 7-Day SOV Averages')
    .setOption('hAxis', { title: 'Date' })
    .setOption('vAxes', {
      0: { title: 'Keyword Count' },
      1: { title: 'Share of Voice (7-day avg)', format: 'percent' }
    })
    // Series mapping: 0=AIO_count, 1=AIO_SOV, 2=AI_Mode_count, 3=AI_Mode_SOV, 4=keywords_tracked,
    //                 5=AIO_count_7dma, 6=AI_Mode_count_7dma, 7=AIO_sov_7dma, 8=AI_Mode_sov_7dma
    // We'll show daily counts (0,2) on axis 0, hide raw daily SOV (1,3) to reduce noise,
    // show smoothed SOV (7,8) on axis 1, and hide keywords_tracked (4) + count_7dma (5,6) from display.
    .setOption('series', {
      0: { targetAxisIndex: 0 }, // AIO_count (line)
      1: { targetAxisIndex: 1, visibleInLegend: false, lineWidth: 0, pointsVisible: false }, // raw AIO SOV (hidden)
      2: { targetAxisIndex: 0 }, // AI_Mode_count (line)
      3: { targetAxisIndex: 1, visibleInLegend: false, lineWidth: 0, pointsVisible: false }, // raw AI Mode SOV (hidden)
      4: { visibleInLegend: false, lineWidth: 0, pointsVisible: false }, // keywords_tracked (hidden)
      5: { visibleInLegend: false, lineWidth: 0, pointsVisible: false }, // AIO_count_7dma (hidden to avoid clutter)
      6: { visibleInLegend: false, lineWidth: 0, pointsVisible: false }, // AI_Mode_count_7dma (hidden)
      7: { targetAxisIndex: 1 }, // AIO_sov_7dma (smooth)
      8: { targetAxisIndex: 1 }  // AI_Mode_sov_7dma (smooth)
    })
    .setOption('legend', { position: 'bottom' })
    .build();

  sum.insertChart(chart);
}

/** Simple trailing rolling mean with window W; returns array aligned to input length (nulls until window is filled). */
function rollingMean_(arr, W) {
  const out = new Array(arr.length).fill(null);
  let sum = 0;
  for (let i = 0; i < arr.length; i++) {
    sum += (typeof arr[i] === 'number' ? arr[i] : 0);
    if (i >= W) sum -= (typeof arr[i - W] === 'number' ? arr[i - W] : 0);
    if (i >= W - 1) out[i] = sum / W;
  }
  return out;
}


/** Helper: count how many rows have TRUE in booleanCol, grouped by date from dateCol. */
function countByDate_(sheet, dateCol, booleanCol) {
  const rows = sheet.getRange(2, 1, sheet.getLastRow() - 1, sheet.getLastColumn()).getValues();
  const counts = {};
  rows.forEach(row => {
    const ts = row[dateCol - 1];
    const has = row[booleanCol - 1];
    if (ts && (has === true || has === 'TRUE')) {
      const d = new Date(ts);
      const dateStr = Utilities.formatDate(d, Session.getScriptTimeZone(), 'yyyy-MM-dd');
      counts[dateStr] = (counts[dateStr] || 0) + 1;
    }
  });
  return counts;
}


function countTrue_(sheet, col) {
  if (!sheet || sheet.getLastRow() < 2) return 0;
  const vals = sheet.getRange(2, col, sheet.getLastRow() - 1, 1).getValues().flat();
  return vals.filter(v => v === true || v === 'TRUE').length;
}

/**
 * Build a pivot for BRAND presence (latest run only).
 * For each surface (AIO / AI_MODE), we compute:
 *  - queries_with_surface: number of keywords where that surface triggered
 *  - queries_brand_cited: number of those keywords where brand domain appears in any citation
 *  - presence_rate = brand_cited / queries_with_surface
 *  - queries_brand_rank1: number where brand is rank 1 citation
 *  - rank1_rate = brand_rank1 / queries_with_surface
 */
function buildBrandPresencePivotAndChart_() {
  const ss = SpreadsheetApp.getActiveSpreadsheet();
  const brands = readBrands_(ss); // array of domains (no www)

  const aioSheet = ss.getSheetByName('AIO_Results');
  const aimSheet = ss.getSheetByName('AI_Mode_Results');
  const srcSheet = ss.getSheetByName('AI_Sources');

  if (!brands.length || !srcSheet || srcSheet.getLastRow() < 2) {
    ensureSheet_(ss, 'GEO_BrandPresence', ['brand_domain', 'surface', 'queries_with_surface', 'queries_brand_cited', 'presence_rate', 'queries_brand_rank1', 'rank1_rate']);
    return;
  }

  // Determine latest run timestamp (max timestamp across results)
  const latest = latestTimestamp_([aioSheet, aimSheet, srcSheet].filter(Boolean));
  if (!latest) return;

  // Build per-surface sets of keywords that triggered surface in the latest run
  const latestAioKeywords = new Set(filterKeywordsByTimestampAndBool_(aioSheet, latest, 4)); // has_ai_overview
  const latestAimKeywords = new Set(filterKeywordsByTimestampAndBool_(aimSheet, latest, 4)); // has_ai_mode

  // Build maps for brand presence by keyword and rank1 by keyword (latest run only)
  const surfaceBrandAny = { AIO: new Map(), AI_MODE: new Map() }; // brand -> Set(keywords)
  const surfaceBrandRank1 = { AIO: new Map(), AI_MODE: new Map() }; // brand -> Set(keywords)

  // Iterate source rows for latest timestamp only
  const srcVals = srcSheet.getRange(2, 1, srcSheet.getLastRow() - 1, 9).getValues();
  for (const row of srcVals) {
    const [ts, kw, country, surface, rank, url, domain/*clean*/, title, site_name] = row;
    if (!sameDay_(ts, latest)) continue; // group by day/run timestamp granularity

    const dom = String(domain || '').toLowerCase();
    if (!dom) continue;

    // For presence calculations, only consider keywords that triggered that surface
    if (surface === 'AIO' && !latestAioKeywords.has(kw)) continue;
    if (surface === 'AI_MODE' && !latestAimKeywords.has(kw)) continue;

    // For each brand, check match
    for (const b of brands) {
      if (dom.endsWith(b)) {
        // any-cited
        if (!surfaceBrandAny[surface].has(b)) surfaceBrandAny[surface].set(b, new Set());
        surfaceBrandAny[surface].get(b).add(kw);

        // rank1
        if (rank === 1) {
          if (!surfaceBrandRank1[surface].has(b)) surfaceBrandRank1[surface].set(b, new Set());
          surfaceBrandRank1[surface].get(b).add(kw);
        }
      }
    }
  }

  // Prepare output rows
  const out = [];
  const surfaces = ['AIO', 'AI_MODE'];
  for (const s of surfaces) {
    const queriesWithSurface = (s === 'AIO') ? latestAioKeywords.size : latestAimKeywords.size;
    for (const b of brands) {
      const cited = surfaceBrandAny[s].get(b)?.size || 0;
      const r1 = surfaceBrandRank1[s].get(b)?.size || 0;
      const presenceRate = queriesWithSurface ? (cited / queriesWithSurface) : 0;
      const rank1Rate = queriesWithSurface ? (r1 / queriesWithSurface) : 0;
      out.push([
        b, s, queriesWithSurface, cited, presenceRate, r1, rank1Rate
      ]);
    }
  }

  const pivot = ensureSheet_(ss, 'GEO_BrandPresence', ['brand_domain', 'surface', 'queries_with_surface', 'queries_brand_cited', 'presence_rate', 'queries_brand_rank1', 'rank1_rate']);
  // Clear old data
  if (pivot.getLastRow() > 1) pivot.getRange(2, 1, pivot.getLastRow() - 1, 7).clearContent();
  if (out.length) pivot.getRange(2, 1, out.length, 7).setValues(out);

  // Build/refresh a chart for Rank-1 share per brand per surface
  const charts = pivot.getCharts();
  charts.forEach(c => pivot.removeChart(c));

  // Simple approach: chart all rows, data has both surfaces; users can filter in Sheets UI.
  const chart = pivot.newChart()
    .setChartType(Charts.ChartType.COLUMN)
    .addRange(pivot.getRange(1, 1, Math.max(2, pivot.getLastRow()), 7))
    .setPosition(5, 1, 0, 0)
    .setOption('title', 'Brand Rank-1 Share (latest run)')
    .setOption('series', {
      0: { targetAxisIndex: 0 }, // presence metrics
      1: { targetAxisIndex: 0 },
      2: { targetAxisIndex: 1 }  // rate on secondary axis if desired
    })
    .setOption('legend', { position: 'right' })
    .build();
  pivot.insertChart(chart);
}

/* ---------- Pivot helpers ---------- */

function readBrands_(ss) {
  const sh = ss.getSheetByName('Brands');
  if (!sh || sh.getLastRow() < 2) return [];
  const vals = sh.getRange(2, 1, sh.getLastRow() - 1, 1).getValues().flat()
    .map(String).map(v => v.trim().toLowerCase().replace(/^www\./, ''))
    .filter(Boolean);
  return Array.from(new Set(vals));
}

function latestTimestamp_(sheets) {
  let latest = null;
  for (const sh of sheets) {
    if (!sh || sh.getLastRow() < 2) continue;
    const tsCol = 1; // first col in our schemas
    const vals = sh.getRange(2, tsCol, sh.getLastRow() - 1, 1).getValues().flat();
    for (const v of vals) {
      const d = (v instanceof Date) ? v : new Date(v);
      if (!isNaN(+d)) {
        if (!latest || d > latest) latest = d;
      }
    }
  }
  return latest;
}

function sameDay_(a, b) {
  if (!(a instanceof Date)) a = new Date(a);
  if (!(b instanceof Date)) b = new Date(b);
  return a.getFullYear() === b.getFullYear() &&
         a.getMonth() === b.getMonth() &&
         a.getDate() === b.getDate();
}

function filterKeywordsByTimestampAndBool_(sheet, latestTs, boolColIndex) {
  if (!sheet || sheet.getLastRow() < 2) return [];
  const rows = sheet.getRange(2, 1, sheet.getLastRow() - 1, sheet.getLastColumn()).getValues();
  const out = [];
  for (const r of rows) {
    const ts = r[0];
    const kw = r[1];
    const val = r[boolColIndex - 1];
    if (sameDay_(ts, latestTs) && (val === true || val === 'TRUE')) out.push(kw);
  }
  return out;
}
The script calls /api/v1/serp_ai first to get a combined snapshot of AI Overview and AI Mode when available. If you’re in the US, it also calls /api/v1/serp_ai_mode for a faster, cached AI Mode result, which is preferred if both are present. In the payload, AI Overview is typically found under data.results.ai_overview and AI Mode under data.results.ai_mode, each with an array of sources. These are parsed into a clean set of domains for pivoting.
Google Apps Script interacts with Sheets in simple ranges, so the script:
Because results are appended, not overwritten, you build a historical dataset automatically. This lets you chart trends like “% of tracked keywords with AIO citations over time” or “top-cited domains in AI Mode by week.”
While SaaS solutions will be more robust, there are many use cases that may require you to do your own tracking. This approach with FetchSERP can support many of the individual optimization scripts that you develop.
Tracking citations on Perplexity AI is more straightforward in one sense: The platform prioritizes transparency, surfacing citations inline as the answer loads. Your detection agents can parse these inline references almost immediately. The complication is that Perplexity aggressively rewrites queries behind the scenes, so the retrieval query that actually pulled in your content may differ significantly from the one you entered. Capturing the platform’s reformulated queries alongside the output is crucial for diagnosing why you were or weren’t cited.
You can apply similar scraping techniques to FetchSERP’s. The following is a list of CSS selectors for scraping the components.
Bonus: Perplexity often renders a JSON state in script[type=”application/json”] (or via a window.__… hydration object). If you see it, parse it for a stable list of sources with titles, authors, and URLs rather than relying on DOM scraping.
Copilot introduces a different dynamic. Since it pulls from Bing’s index and ranking systems, your eligibility for generative citations is heavily dependent on your Bing SEO performance. Copilot often places citations toward the end of its responses, which makes them less prominent and potentially less likely to be clicked. For monitoring, you need to capture the generative block in its entirety and parse it for linked domains. By comparing those results with traditional Bing rankings for the same query, you can spot patterns — for example, whether top-ranking Bing results are more likely to be cited, or whether certain authority signals override ranking position in Copilot’s retrieval.
Here are the CSS selectors for Copilot:
The output of all this work is a centralized dashboard that consolidates your active monitoring data and passive log data into a single, query-driven view of AI Search visibility. This is where you translate raw detection into strategic insight.
A well-constructed dashboard doesn’t just tell you whether you’re cited, it contextualizes the citation. For each query, you should see whether the AI panel was triggered at all, which platform(s) cited you, how prominently you were cited, how often you’ve been cited over the last 30 days, and whether those appearances correspond with spikes in AI bot crawling. Over time, you can layer in correlations with conversion events or other performance KPIs, creating a cause-and-effect view that was impossible in early GEO measurement.
The dashboard’s purpose is to give you a time-series view of how often your tracked keywords trigger:
It combines:
After your first script run, your spreadsheet will contain:
In GEO_AISummary, the script writes:
Column | Name | Description |
A | date | Calendar date of the run (from timestamp) |
B | AIO_count | Number of keywords triggering AIO that day |
C | AIO_share_of_voice | AIO_count ÷ keywords_tracked |
D | AI_Mode_count | Number of keywords triggering AI Mode that day |
E | AI_Mode_share_of_voice | AI_Mode_count ÷ keywords_tracked |
F | keywords_tracked | Total keywords in your tracking list |
G | AIO_count_7dma | 7-day rolling average of AIO_count |
H | AI_Mode_count_7dma | 7-day rolling average of AI_Mode_count |
I | AIO_sov_7dma | 7-day rolling average of AIO SOV |
J | AI_Mode_sov_7dma | 7-day rolling average of AI Mode SOV |
While the script already generates a chart, building your own manually gives you more control.
Tracking both raw counts and smoothed SOV means:
This is essentially your Generative Search Visibility Dashboard. While you can automate everything, building it manually first makes it easier to experiment with new chart views and metrics before locking them into code.
By the end of this process, you’ve replaced the guesswork of “I think we’re showing up in AI answers” with a quantified, defensible view of your generative search footprint. You can see exactly where you’re gaining or losing ground and, more important, why. This level of measurement is the foundation for GEO strategy. Without it, you’re optimizing in the dark.
If your brand isn’t being retrieved, synthesized, and cited in AI Overviews, AI Mode, ChatGPT, or Perplexity, you’re missing from the decisions that matter. Relevance Engineering structures content for clarity, optimizes for retrieval, and measures real impact. Content Resonance turns that visibility into lasting connection.
Schedule a call with iPullRank to own the conversations that drive your market.
The appendix includes everything you need to operationalize the ideas in this manual, downloadable tools, reporting templates, and prompt recipes for GEO testing. You’ll also find a glossary that breaks down technical terms and concepts to keep your team aligned. Use this section as your implementation hub.
//.eBook

The AI Search Manual is your operating manual for being seen in the next iteration of Organic Search where answers are generated, not linked.
Prefer to read in chunks? We’ll send the AI Search Manual as an email series—complete with extra commentary, fresh examples, and early access to new tools. Stay sharp and stay ahead, one email at a time.
Sign up for the Rank Report — the weekly iPullRank newsletter. We unpack industry news, updates, and best practices in the world of SEO, content, and generative AI.
iPullRank is a pioneering content marketing and enterprise SEO agency leading the way in Relevance Engineering, Audience-Focused SEO, and Content Strategy. People-first in our approach, we’ve delivered $4B+ in organic search results for our clients.
We’ll break it up and send it straight to your inbox along with all of the great insights, real-world examples, and early access to new tools we’re testing. It’s the easiest way to keep up without blocking off your whole afternoon.